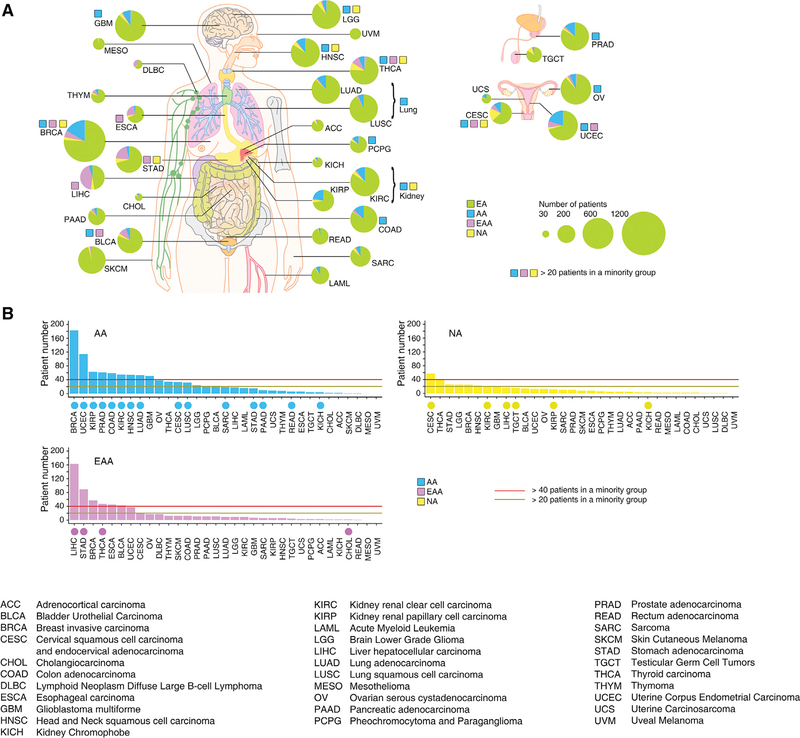
Figure 3. The Genetic Ancestry of TCGA Patients.
(A) Summary of genetic ancestry of TCGA patients across 33 cancer types. The size of each circle corresponds to the number of samples of a given cancer type, and the proportion of each genetic ancestry is indicated by color. A color-coded square indicates that the sample number of a given minority genetic ancestry group is larger than 20.
(B) Summary of the patient numbers of each minority genetic ancestry group. The cancer types in each minority group are ranked by the number of minority patients in the group. The cancer types that show evidence for racial disparities are labeled by a color-coded circle in each minority group.
See also Tables S3 and S4.

