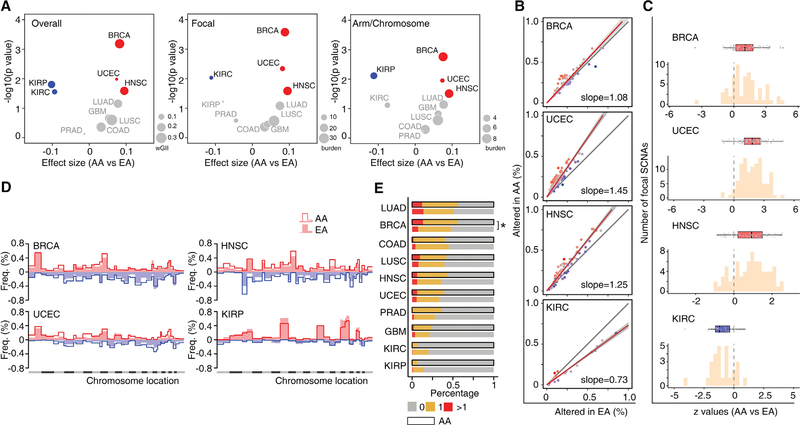
Figure 4. AA Genetic Ancestry and Global Somatic Copy-Number Alterations.
(A) Volcano plot of log10 (p value) against effect size (AA versus EA), representing the difference in SCNA scores between AA and EA patients across 10 cancer types. Each circle corresponds to a cancer type with size proportional to median burden of SCNA: weighted genomic instability index at overall level, weighted sum of SCNA events at the focal level or the arm/chromosomal level. Significance (y axis) and effect size (x axis) were calculated by linear regression adjusting for a clinical factors-derived propensity score. SCNA scores were rank-scaling transformed as a conservative measure to avoid results driven by outliers. Positive effect size corresponded to elevation of SCNA score in AA patients and negative values to reduction. The cancer types with significantly elevated or reduced SCNA scores in AA patients (FDR < 10%) are shown in red or blue, respectively. Cancer types with non-significant results are colored in gray.
(B) Comparison of the alteration frequency for recurrent focal SCNAs in AA versus EA patients of BRCA, UCEC, HNSC, and KIRC, respectively. Dots represent recurrent focal SCNAs (peak regions) identified by GISTIC. The y and x axes represent the alteration frequency for a peak region in AA and EA patients, respectively. The gray line indicates the null hypothesis (y = x) that AA patients are affected at an equal rate with EA patients at each peak region. A fitted line on all dots is plotted, with slope indicating the overall difference in alteration rate at peak regions. The fitted line is colored red if the slope is greater than one and blue if the slope is less than one.
(C) Histogram of Z values by logistic regression comparing alteration frequency of recurrent focal SCNAs between AA and EA patients, with clinical factors adjusted. For each cancer type, boxplot lines reflect lower quartile, median, and upper quartile of Z values. Whiskers extend 1.5 times the interquartile range from the upper and lower quartiles, with points outside representing outliers. Each point represents a recurrent focal SCNA. Boxes are colored red if the lower quartile is above zero and blue if the upper quartile is below zero.
(D) Comparison of the alteration frequency of arm-level SCNAs across the whole genome in BRCA, UCEC, HNSC, and KIRP. An arm-level value of the log2 copy-number change ratio larger than 0.25 was considered an arm copy-number alteration. For each chromosome arm in a certain cancer type, the frequency of gain (red, above horizontal line) or loss (blue, under horizontal line) was calculated and plotted separately. Alteration frequency of each chromosome arm in a given cancer type is plotted as lines or filled bars for AA or EA patients, respectively.
(E) Frequency of genome doubling stratified by genetic ancestry (AA versus EA) in each cancer type. The cancer types with significantly different odds of WGD event in AA patients (FDR < 10%) are marked with an asterisk.
See also Figure S3.

