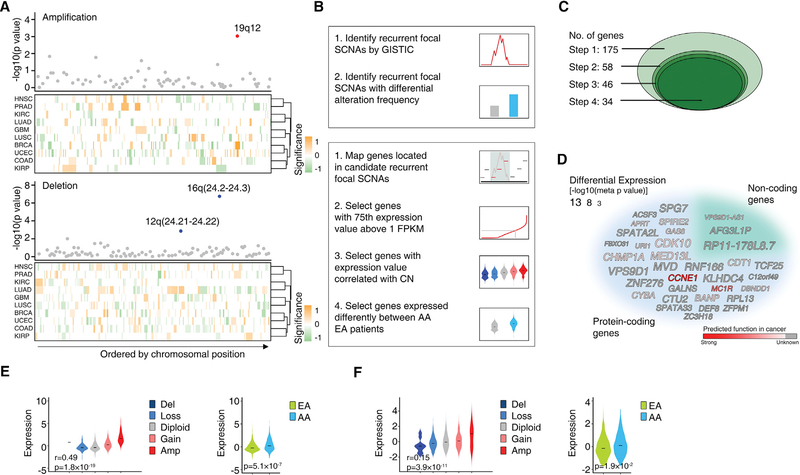
Figure 5. AA Genetic Ancestry and Focal Copy-Number Alterations.
(A) Three recurrent focal SCNAs with significantly different alteration frequencies between AA and EA patients were identified by a pan-cancer meta-analysis across 10 cancer types. The top dot plots show the significance (y axis) of the meta-analysis. Dots represent recurrent focal SCNAs (peak regions) identified in at least two cancer types, ordered by genomic location. The red or blue dots represent the recurrent focal SCNAs identified to be altered at significantly different rates in AA patients compared with EA patients (with FDR < 10%) by a pan-cancer meta-analysis across ten cancer types (red represent amplification and blue represent deletions, respectively). The bottom heatmaps show schematic boundaries of peak regions identified by GISTIC in each cancer type. Cancer types are clustered by similarity of independent significance upon analysis on the cancer-specific level by controlled permutation test. Significance for each recurrent focal SCNA on the cancer-specific level is colored with intensity (a higher-intensity color represents a more significant difference; orange represents higher alteration rate in AA patients and green represents lower alteration rate in AA patients, respectively).
(B) Simplified workflow of the computational approaches used to identify recurrent focal SCNAs with significantly different alteration frequencies between AA and EA patients (top), and genes potentially contributing to disparity through SCNAs (bottom).
(C) Diagram shows the number of candidate genes during the stepwise filtering depicted in (B).
(D) Word cloud of the genes potentially contributing to disparity through SCNAs identified by pan-cancer analysis. The size of the font indicates the significance (p value on a negative log scale) of differential expression between AAs and EAs after adjusting for clinical factors. Gray indicates the function of the gene in cancer is unknown and the intensity of red color indicates prediction score of gene function in cancer.
(E and F) Violin plots showing the cancer type-adjusted RNA expression levels of CCNE1 (E) and VPS9D1-AS1 (F) across given cancer types, with samples grouped based on gene copy number (left) or genetic ancestry (right). The central line within each violin represents the median value. Correlations between RNA expression and predicted gene copy numbers (left) were calculated by meta-analysis. Tests for differential expression between AA and EA tumors (right) were calculated by meta-analysis adjusting for clinical factors.
See also Figure S3; Tables S5–S8.

