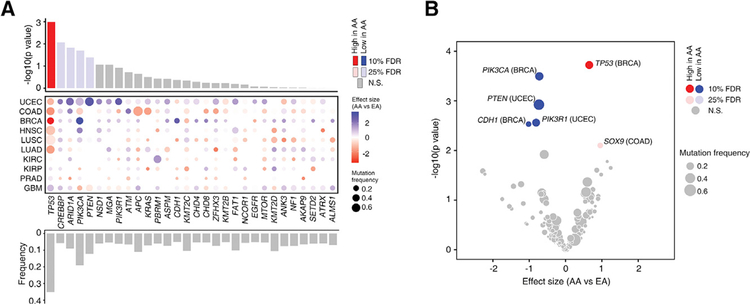
Figure 6. AA Genetic Ancestry and Somatic Mutation.
(A) Summary of pan-cancer meta-analysis on recurrently mutated genes between AA and EA patients across 10 cancer types. The top bar plot shows the significance (y axis) of the meta-analysis for each recurrently mutated gene. Red and blue bars represent the genes whose mutation frequencies are significantly higher and lower in AAs compared with EA, respectively. The middle dot plot shows independent differences in mutation frequency in each cancer type. The intensity of color corresponds to effect size of AA ancestry compared with EAs (red and blue indicate higher and lower frequencies in AA, respectively). The size corresponds to overall mutation frequency of a given gene in a specific cancer type. Cancer types are ordered by similarity between statistical measures (Z score based) observed at the individual cancer type level and at the pan-cancer level. The bottom bar plot shows the mutation frequency of the recurrently mutated genes across 10 cancer types.
(B) Summary of the cancer type-specific analysis on recurrently mutated genes between AA and EA patients in ten cancer types. The volcano plot of −log10 (p value) against effect size (AA versus EA) represents the difference in mutation frequency between AA and EA patients for a given cancer type after adjusting for clinical factors. Each circle corresponds to a gene tested in a specific cancer type with size proportional to overall mutation frequency. Red and blue circles represent the genes whose mutation frequencies are significantly higher and lower in AAs compared with EA, respectively.

