
Figure 2.
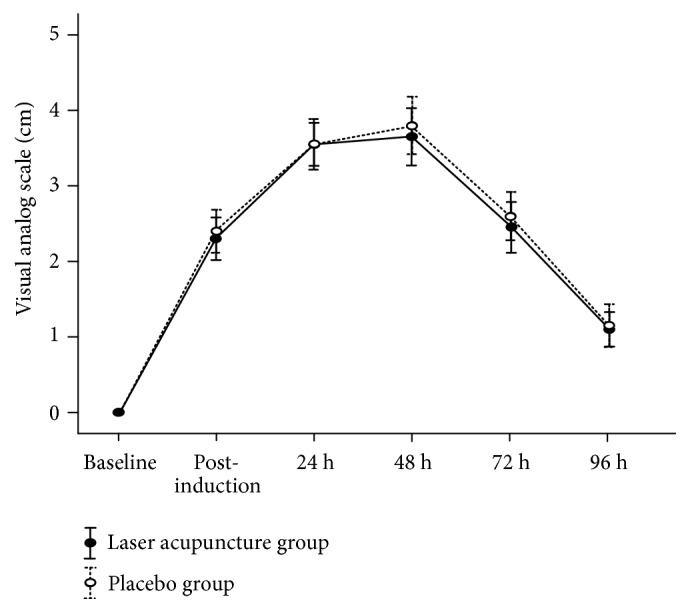
Visual analog scale (mean ± standard error) of muscle soreness from 2 groups at baseline, postinduction, and 24, 48, 72, and 96 h after inducing delayed muscle soreness.
Official websites use .gov
A
.gov website belongs to an official
government organization in the United States.
Secure .gov websites use HTTPS
A lock (
) or https:// means you've safely
connected to the .gov website. Share sensitive
information only on official, secure websites.
Visual analog scale (mean ± standard error) of muscle soreness from 2 groups at baseline, postinduction, and 24, 48, 72, and 96 h after inducing delayed muscle soreness.