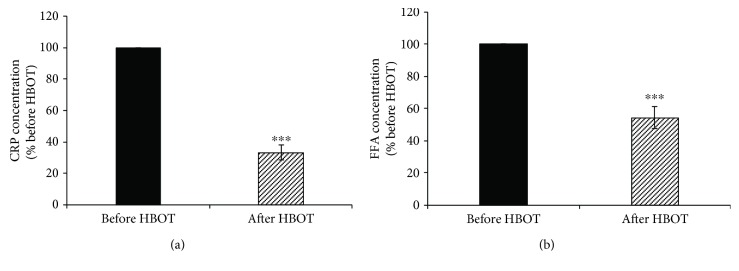
Figure 1.
Effects of HBOT on plasma CRP and FFA levels. (a) The plasma level of CRP; (b) the plasma level of FFA. Results are expressed as % of the value obtained before HBOT and represent mean ± SEM (n = 15); ∗∗∗p < 0.001. CRP: C-reactive protein; FFA: free fatty acid. Other abbreviations are under Table 1.

