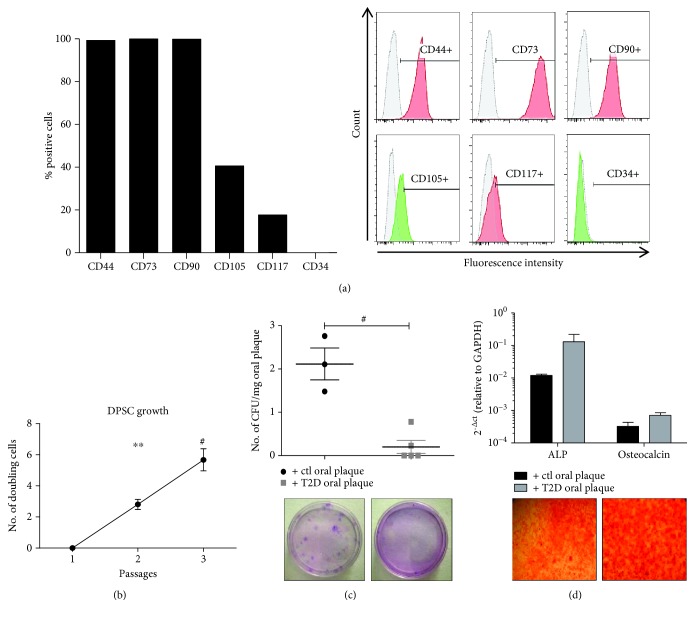
Figure 1.
(a) Flow cytometry analysis of DPSCs after isolation. The graph shows that DPSC cultures exhibit a mesenchymal-like immunophenotype with positivity to the main stromal markers and negativity to the hematopoietic marker CD34. Representative cytofluorimetric histograms are displayed on the right (red and green histograms and APC and FITC fluorochromes, respectively). (b) Cell growth profile of DPSCs. The graph displays that the number of doubling cells is significantly increased at higher passages. Results were normalized to passage 1. ∗∗p < 0.01, #p < 0.0001. (c) The graph shows that the number of clones generated by DPSCs in the presence of T2D oral plaque is significantly lower compared to that in controls (ctls). The number of CFU was normalized to the amount of oral plaque (mg). Below the graph, representative optical images of CFU stained with Giemsa are shown. #p < 0.0001. (d) Osteogenic differentiation of DPSCs. The graph displays the gene expression levels of ALP and osteocalcin which are unaltered between the two treatments. Below the graph, representative optical images of osteogenic differentiation of DPSCs stained with Alizarin red. Magnification: 10x.

