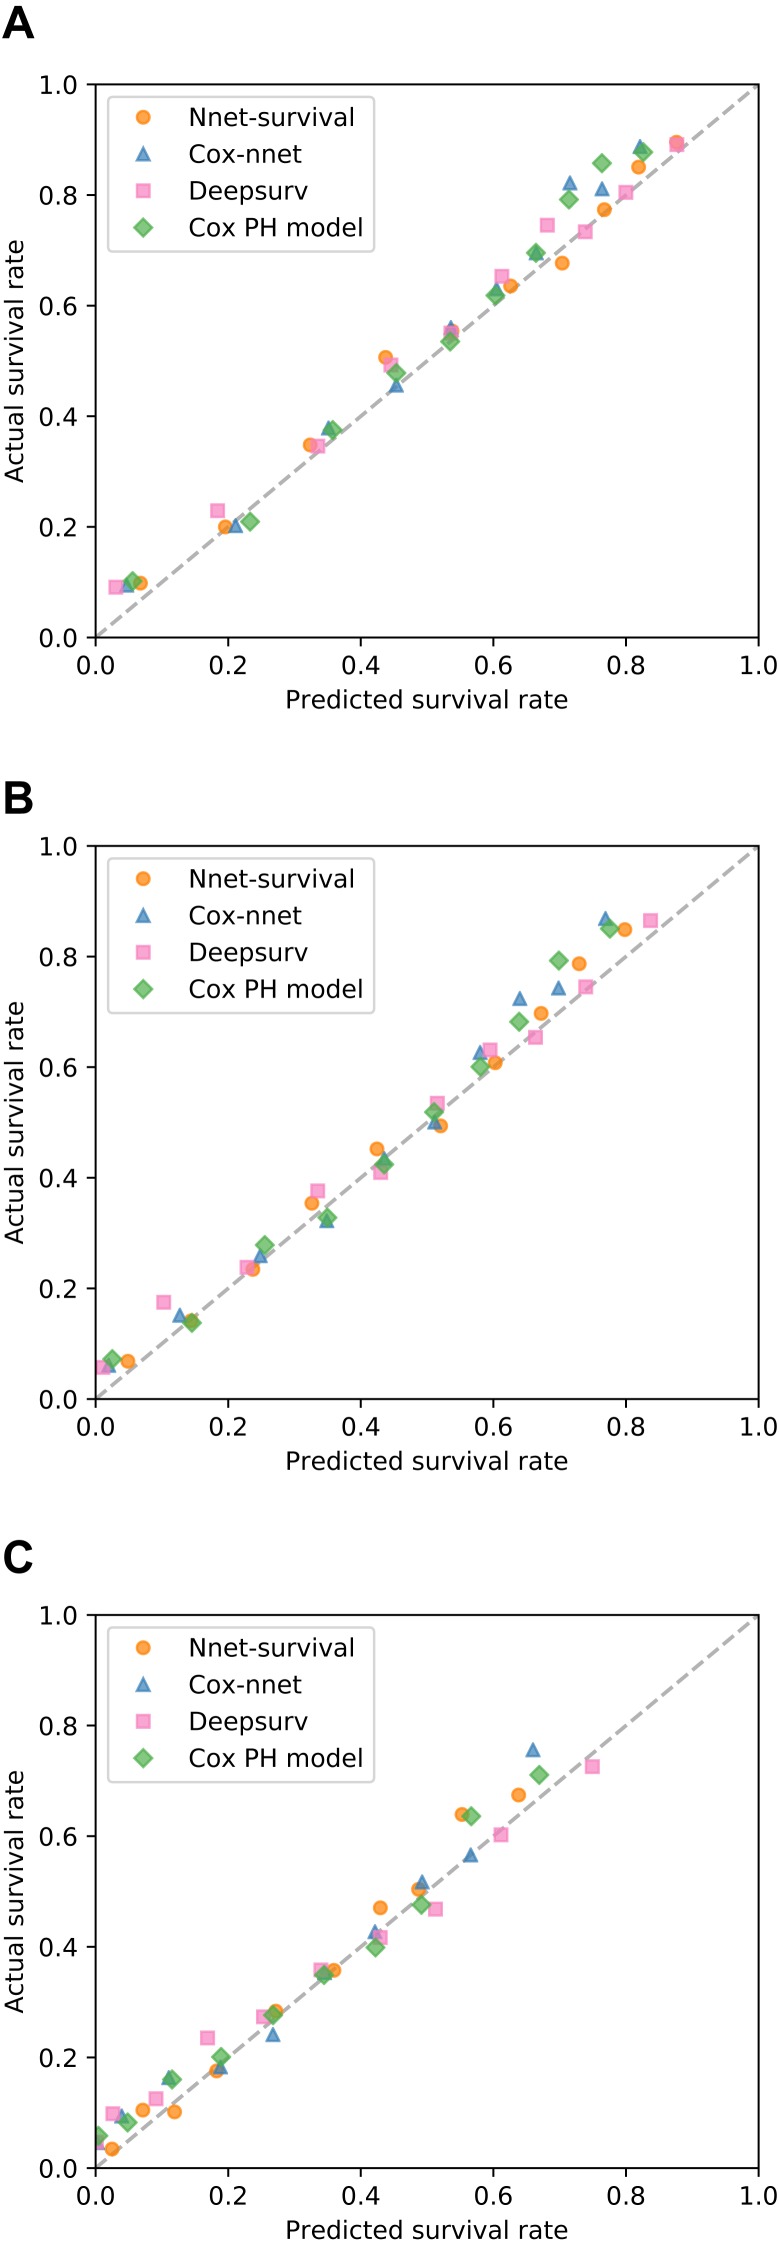
Figure 6. Calibration of four survival models on SUPPORT study test set.
For each model, for each of three follow-up times, patients were grouped by deciles of predicted survival probability. Then, for each decile, mean actual survival (Kaplan–Meier method) was plotted against mean predicted survival. A perfectly calibrated model would have all points on the identity line (dashed). Follow-up times: (A) 6 months; (B) 1 year; (C) 3 years.

