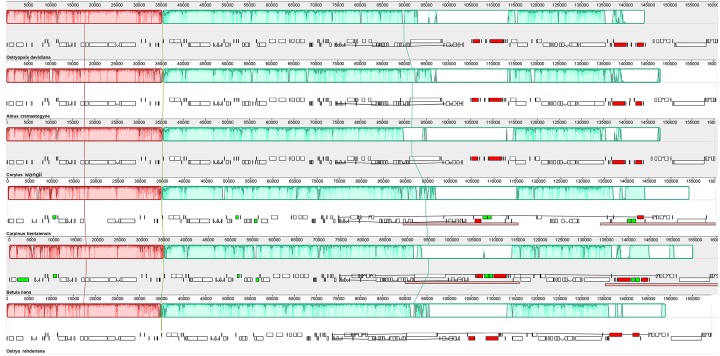
Figure 3. Synteny and rearrangements detected in six Betulaceae chloroplast genomes using the Mauve multiple-genome alignment program.
Color plots reflect the level of sequence similarity, and lines linking blocks with the same color represent homology between two genomes. Ruler above each genome indicates nucleotide positions, and white regions indicate element specific to a genome. The above and below gene blocks are transcribed clockwise and transcribed counterclockwise, respectively.

