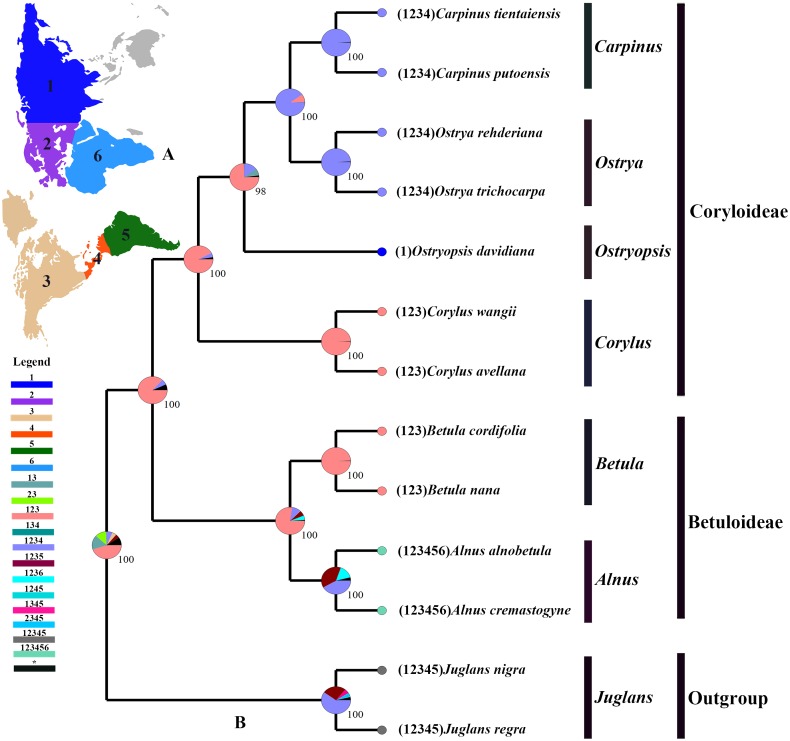
Figure 8. Ancestral area reconstruction based on the BBM method in RASP.
(A) The insert map shows the contemporary distribution of Betulaceae species, covering six major floristic divisions (1–6). (B) Pie charts on each node of the tree indicate marginal probabilities for each alternative ancestral area. Numbers and colors in the legend refer to extant and possible ancestral areas, and combinations of these.

