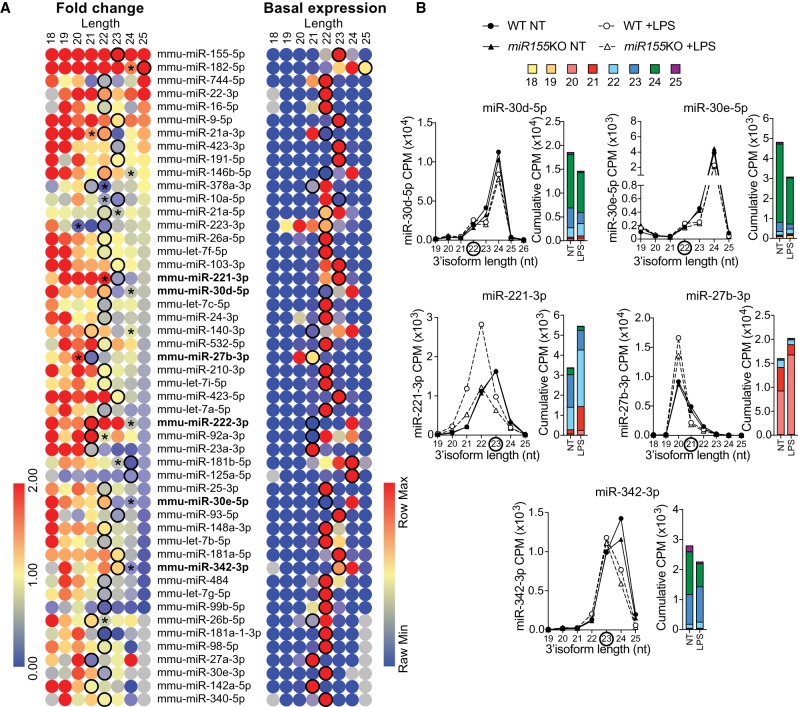
FIGURE 2.
Broad effect of LPS on miRNA isoforms in mouse BMDMs. (A) Heat maps representing the LPS-induced fold change expression of each isoform for the top 50 most abundant miRNA families (right panel), in wild-type (WT) BMDMs, and the basal expression of each isoform within a family in untreated cells (left panel). Fold changes greater than twofold are shown in red (right panel) (values are based on Supplemental Table S4). Black circles highlight miRBase canonical isoforms, while stars refer to abundant isoforms when different from miRBase definition (seen in the right panel). Absent values are shown in gray. miRNA families analyzed further in Figure 1 (i.e., miR-222-3p) or Figure 2B are shown in bold. (B) Detailed analysis of CPM and cumulative CPM for the 3′-end isoforms of selected miRNA families in BMDMs from WT and miR-155-deficient mice (Dueck et al. 2014). For cumulative CPM, the data shown are from WT BMDMs. Data shown are from one biological sample for each condition.

