
FIGURE 6.
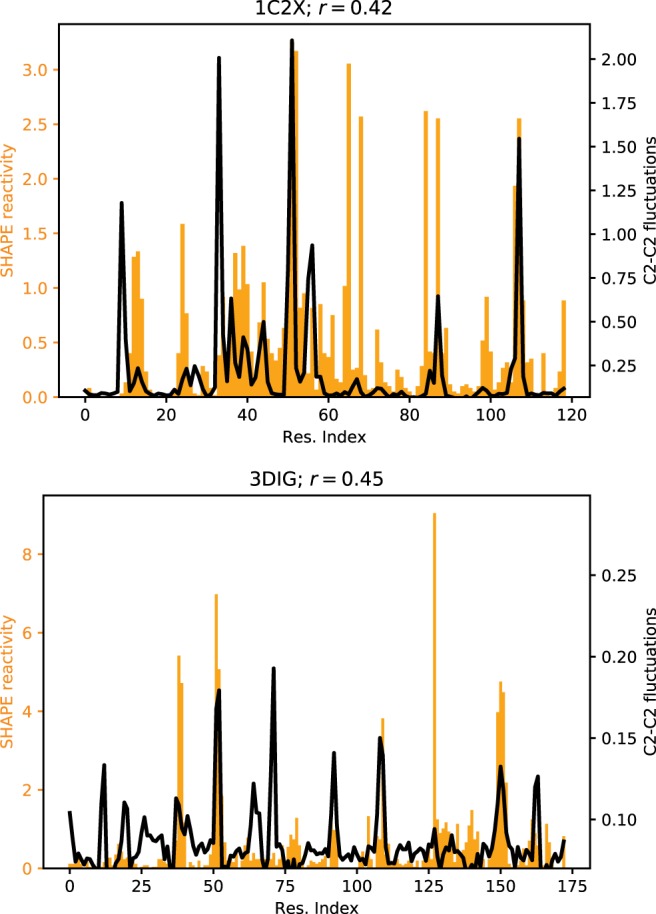
C2–C2 fluctuations as predicted by the ENM of lysine riboswitch (bottom panel) and 5S rRNA (top panel). SHAPE reactivity data from Hajdin et al. (2013) are shown for comparison. Pearson's correlation coefficient r between SHAPE data and ENM-predicted fluctuations is also indicated.