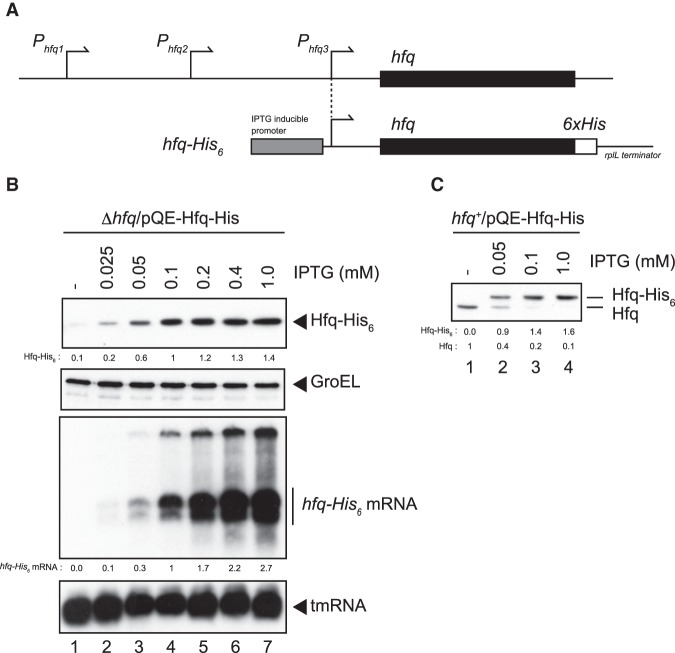
FIGURE 1.
Hfq expression in cells harboring a multicopy hfq-His6 plasmid. (A) The upper diagram represents the chromosomal hfq region and promoters. The hfq gene is part of a complex operon and the transcription of hfq is driven from at least three promoters (Tsui et al. 1994). Two promoters (P1hfq and P2hfq) are located in the coding region of the upstream miaA gene while the adjacent P3hfq is located just upstream of the hfq coding region (black box). The lower diagram is the schematic drawing of the hfq-His6 gene on pQE-Hfq-His. The native P3hfq is replaced with the IPTG-inducible PT5. The original 5′-UTR of hfq is retained in the hfq-His6. The sequence corresponding to 6xHis tag (open box) is followed by the ρ-independent terminator derived from the rplL (Post et al. 1979). (B) Expression of Hfq-His6 and hfq-His6 mRNA. TM589 (Δhfq) cells harboring pQE-Hfq-His were grown in LB medium containing indicated concentrations of IPTG to A600 = ∼0.3. Total proteins and RNAs were prepared. Protein samples equivalent to 0.0125 or 0.0025 A600 units were subjected to western blotting using anti-His6 monoclonal antibody or anti-GroEL polyclonal antibodies, respectively. One μg or 0.25 μg of RNA samples was subjected to northern blotting using hfq or tmRNA probes, respectively. Relative Hfq-His6 levels and relative hfq-His6 mRNA levels are calculated, with the protein and mRNA samples at 0.1 mM IPTG set to one, respectively. (C) Expression of Hfq-His6 in wild-type cells. IT1568 cells harboring pQE-Hfq-His were grown in LB medium containing indicated concentrations of IPTG to A600 = ∼0.6 and total proteins were prepared. Protein samples equivalent to 0.05 A600 units were subjected to western blotting using anti-Hfq polyclonal antibodies. Relative Hfq-His6 and endogenous Hfq levels are calculated, with the endogenous Hfq level without IPTG set to one.

