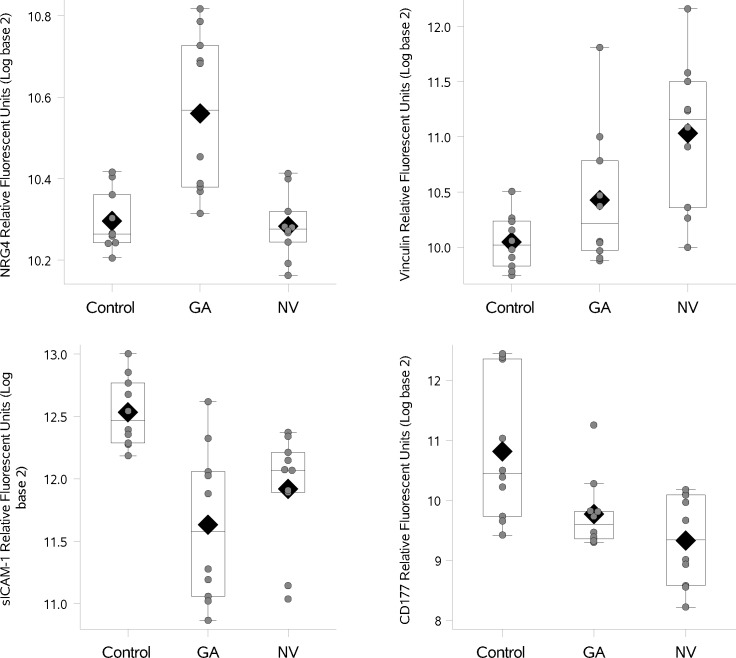
Figure 3.
Distribution of select proteins in patients with GA, NV AMD, and cataract controls. The box indicates the interquartile range (IQR; 25th–75th percentile) and the median and mean are indicated by the lines and diamonds, respectively. Whiskers indicate data within 1.5 times the IQR, and points indicate individual data values.

