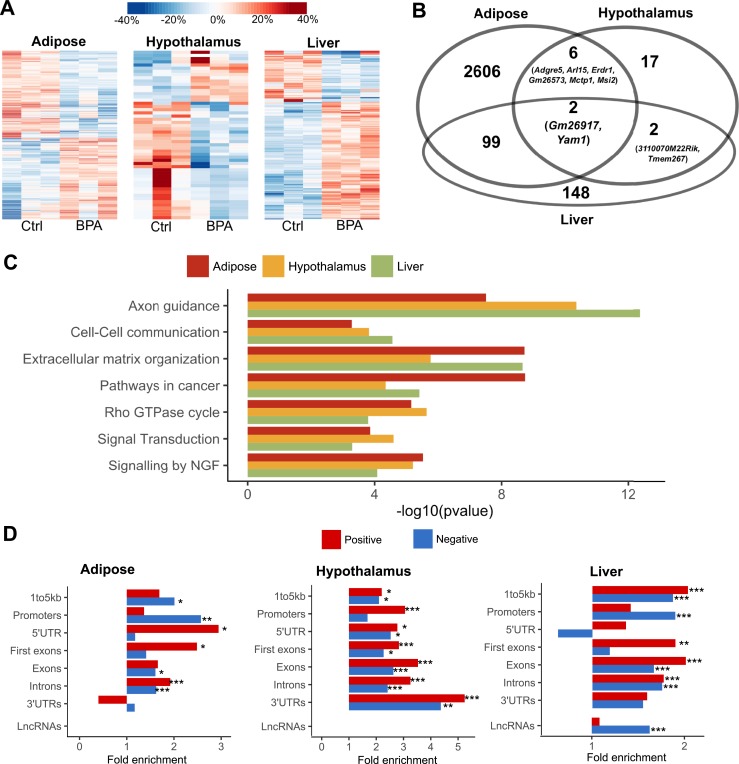
Figure 5.
Prenatal BPA exposure induced methylomic level alteration in adipose, hypothalamus, and liver. (A) Heat map of methylation level changes for the DMCs. Color indicates change in methylation ratio, with red and blue indicating upregulation and downregulation by BPA, respectively. (B) Venn diagram of genes with local DMCs between tissues shows tissue-specific and shared genes mapped to DMCs. (C) Significantly enriched pathways that satisfied FDR <1% across DMCs from adipose, hypothalamus, and liver tissues. Enrichment P value is determined by MSEA. (D) Fold enrichment for positive correlations (red bars) or negative correlations (blue bars) between DMCs and local DEGs, assessed by different gene regions. *P < 0.05; **P < 0.01; ***P < 0.0001; enrichment P values were determined using Fisher exact test. Ctrl, control; NGF, nerve growth factor; UTR, untranslated region.

