. 2018 Dec 6;10(4):1000–1007. doi: 10.1039/c8sc04943b

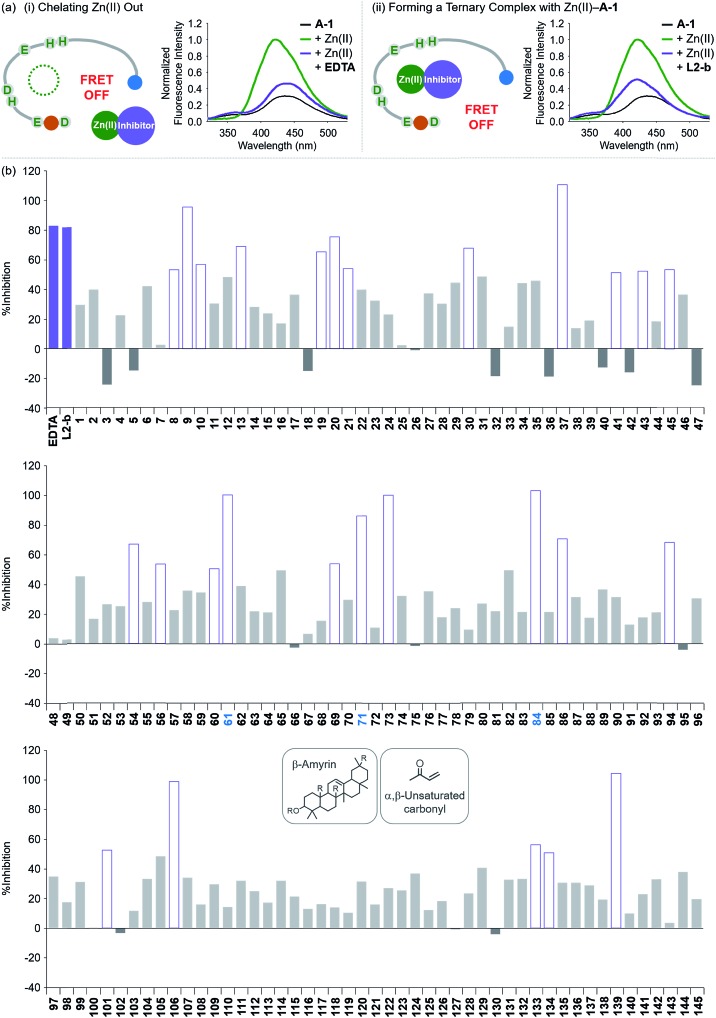
Fig. 4. Change in the FRET signal of Zn(ii)-bound A-1 upon treatment with inhibitors against Zn(ii)–Aβ interaction. (a) Fluorescent responses of A-1 in the presence of both Zn(ii) and compounds: [(i) EDTA and (ii) L2-b]. (b) Inhibition (%) of Zn(ii)–A-1 interaction by incubation with the natural products. Full data sets regarding the inhibition (%) of 145 natural products are summarized in Table S1. 61, 71, and 84 that contain both β-amyrin and α,β-unsaturated carbonyl groups and show >80% inhibition against Zn(ii)–A-1 interaction are labeled in blue. Conditions: [A-1] = 0.3 μM; [ZnCl2] = 100 μM; [inhibitor] = 100 μM; incubation for 10 min; room temperature; λex = 280 nm; λem = 420 nm.

Fig. 4