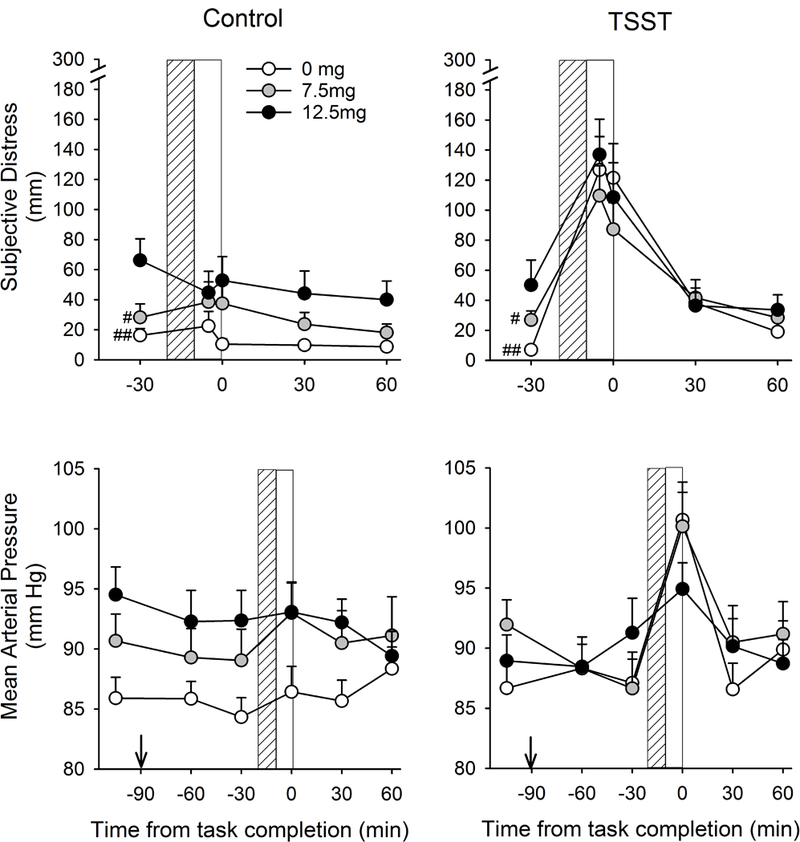
Figure 2:

Changes in subjective distress (VAS) and mean arterial pressure across time after Control and TSST tasks among subjects treated with 0, 7.5 or 12.5 mg THC. Lined and open bars indicate task preparation and performance periods respectively. #Indicates difference from 12.5mg THC #p<0.05 ##p<0.01 (Bonferroni post hoc test). Arrow indicates drug administration.
