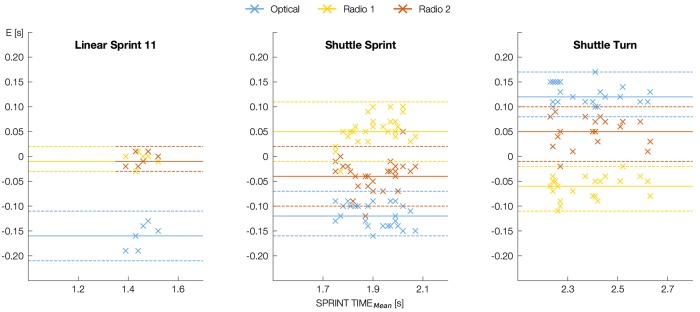
FIGURE 2.
Visualization of accuracy for each trial and each EPTS according to Bland-Altman. The plots show Measurement Error (E) over SPRINT TIMEMean (mean of sprint time measured by EPTS and timing gate) as well as Mean Error (ME, solid colored line) and Lines of Agreement (LOA, dashed colored line) (all in s). Negative values indicate shorter EPTS sprint times compared to the timing gate.

