Figure 4.
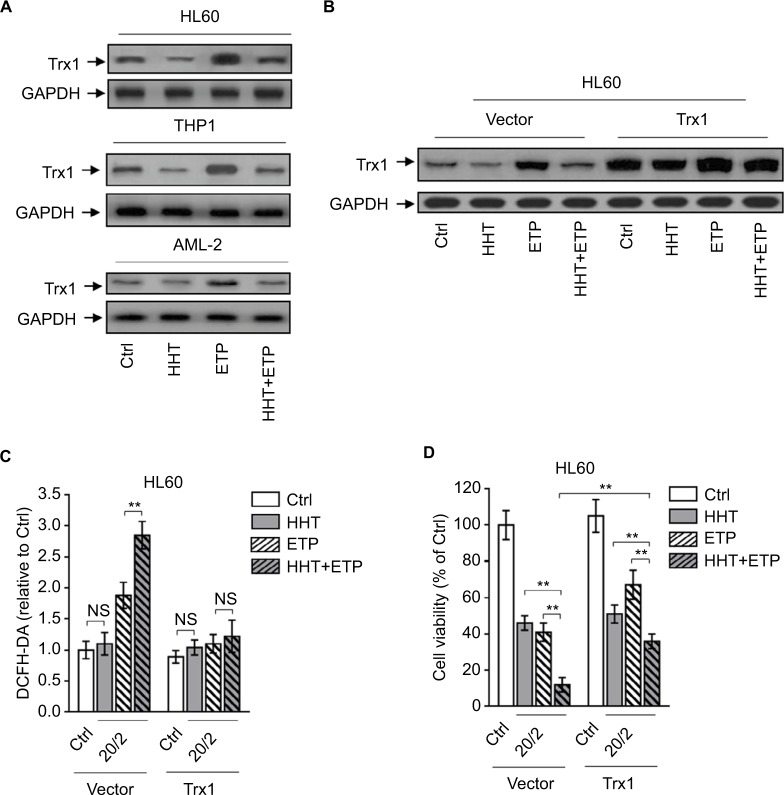
HHT causes elevated ROS generation by disabling thioredoxin-mediated antioxidant defense.
Notes: (A) HL60, THP1, and primary AML cells (AML-2) were treated with vehicle control (Ctrl), HHT, ETP, or in combination as indicated for 48 hours. The protein expression of Trx1 was determined by Western blot. GAPDH was used as a loading control. The representative images (left) and the quantification of band intensity (right) are shown. (B–D) HL60 cells stably overexpressing vector or Trx1 were treated as in (A). (B) The protein expression of Trx1 was determined by Western blot. GAPDH was used as a loading control. The representative images (upper) and the quantification of band intensity (lower) are shown. (C) The intracellular ROS level was detected by flow cytometry analysis using DCFH-DA. Results relative to Ctrl are shown. (D) Cell viability was determined via trypan blue exclusion assay. Results relative to Ctrl are shown (%). Data were obtained from at least three independent experiments and analyzed by Student’s t-test. Data are expressed as mean ± SD. **P<0.01.
Abbreviations: AML, acute myeloid leukemia; DCFH-DA, dichlorofluorescein diacetate; ETP, etoposide; HHT, homoharringtonine; NS, not significant; ROS, reactive oxygen species.

