Figure 1.
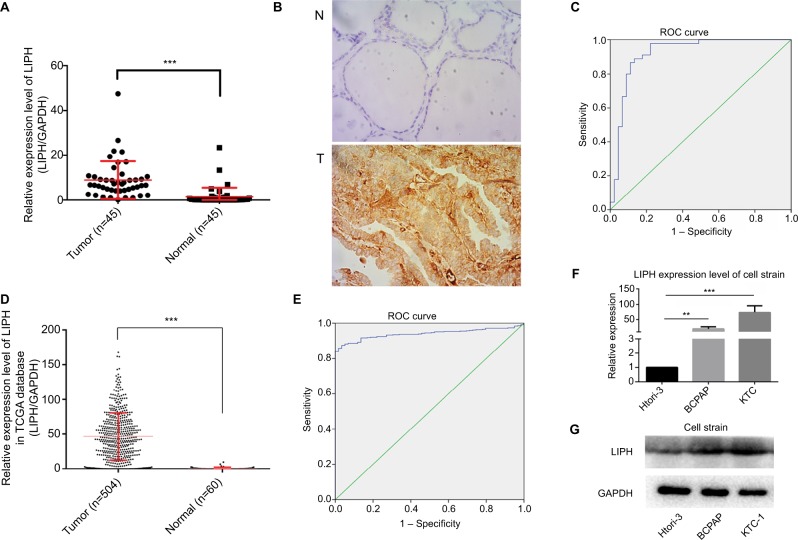
LIPH was relatively overexpressed in PTC tissues and PTC cell lines.
Notes: (A) The expression levels of LIPH in 45 PTC tissues and their paired adjacent normal thyroid tissues were measured by qRT-PCR (Mann–Whitney U test, ***P<0.001). (B) Immunohistochemical analyses were performed to examine the expression levels of LIPH in PTC tissues and adjacent normal tissues (6/6 vs 0/6, ***P<0.001). Magnification ×400. (C) The ROC curve was constructed from the LIPH mRNA expression levels in diagnosing PTC in the validation cohort (AUC 92.0%, P<0.001; sensitivity 88.9; specificity 86.7%). (D) The expression levels of LIPH in 504 PTC tissues and 60 normal thyroid tissues were measured by qRT-PCR (Mann–Whitney U test, ***P<0.001). (E) The ROC curve was constructed from the LIPH mRNA expression levels in diagnosing PTC in the TCGA cohort (AUC 94.0%, P<0.001; sensitivity 87.4; specificity 96.6%). (F) The relative expression levels of LIPH in KTC-1 and BCPAP were significantly higher than in Htori-3 (two-tailed Student’s t-test, **P<0.01, ***P<0.001). (G) The corresponding protein expression levels of LIPH in KTC-1 and BCPAP.
Abbreviations: AUC, area under the curve; GqRT-PCR, quantitative reverse transcription PCR; LIPH, lipase H; N, normal tissue; PTC, papillary thyroid carcinoma; T, tumor tissue; TCGA, The Cancer Genome Atlas; ROC, receiver operating characteristics..

