Figure 3.
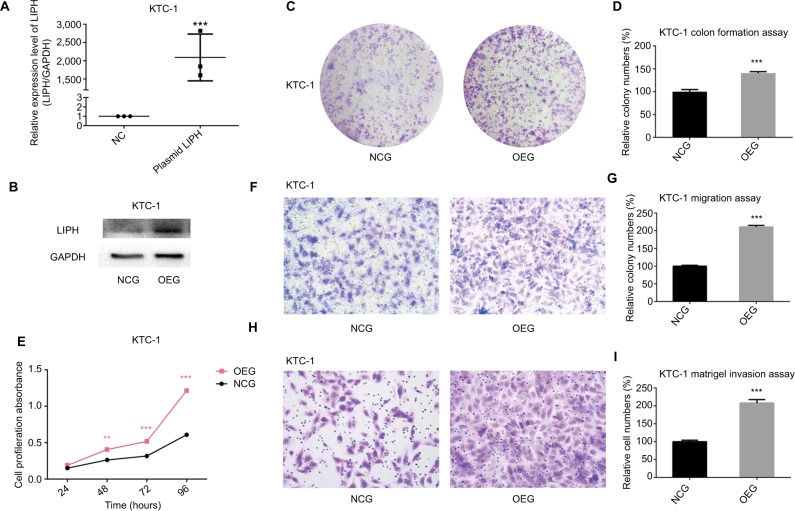
Overexpression of LIPH promoted cell colony formation, proliferation, migration, and invasion.
Notes: (A) In KTC-1, the relative expression level of LIPH was significantly overexpressed by LIPH overexpression plasmid (oe-LIPH) in comparison with the negative control group transfected with empty plasmid (oe-NC) according to qRT-PCR (two-tailed Student’s t-test, ***P<0.001). (B) The corresponding protein expression levels of LIPH overexpressed by overexpression plasmid in KTC-1. (C) Colony formation assay: in KTC-1, OEG formed more colonies than transfected NCG. (D) The columns represent the mean colony number for each group from at least three independent experiments, and the vertical bars on top of the columns represent SD (two-tailed Student’s t-test, ***P<0.001). (E) CCK-8 assay: cell proliferation was significantly promoted in OEG in comparison with NCG (two-tailed Student’s t-test, **P<0.01, ***P<0.001). (F) Transwell migration assay: in KTC-1, OEG had more migrating cells than NCG. (G) The columns represent the mean migrating cell number for each group from at least three independent experiments, and the vertical bars on top of the columns represent SD (two-tailed Student’s t-test, ***P<0.001). (H) Matrigel invasion assay: in KTC-1, OEG had more invading cells than NCG. (I) The columns represent the mean invading cell number for each group from at least three independent experiment, and the vertical bars on top of the columns represent SD (two-tailed Student’s t-test, ***P<0.001).
Abbreviations: CCK-8, Cell Counting Kit-8; GAPDH, glyceraldehyde-3-phosphate dehydrogenase; oe, overexpression; LIPH, lipase H; NC, negative control; NCG, negative control group; OEG, overexpression group; qRT-PCR, quantitative reverse transcription PCR.

