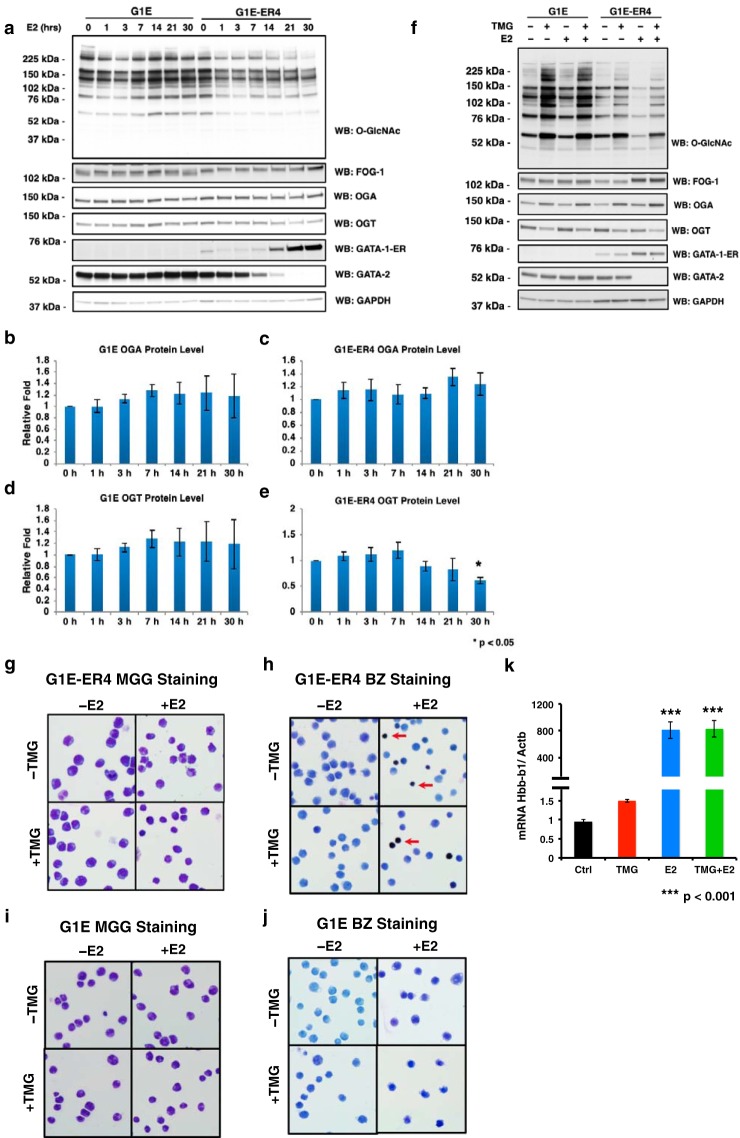
Figure 1.
O-GlcNAc levels decrease following the restoration of GATA-1 activity. G1E and G1E-ER4 cells were treated with TMG (OGA inhibitor) and/or E2 for 30 h. Cells were harvested following a time course (a) or at 30 h (f). Whole-cell lysates were subjected to immunoblotting. Relative OGA (b and c) and OGT (d and e) protein levels of G1E (b and d) and G1E-ER4 (c and e) were quantified by ImageJ 1.49v. * indicates p < 0.05 compared with 0 h. G1E-ER4 (g and h) and G1E (i and j) cells were subjected to May-Grünwald Giemsa (MGG) staining (g and i) for cell morphology and benzidine staining (BZ) (h and j) for hemoglobin content. The red arrow shows hemoglobin-positive cells. k, transcription level of the βmajor-globin gene (Hbb-b1) was measured by RT-qPCR, and β-actin (Actb) was used as an internal control. Boxes represent cropped blots. * indicates p < 0.05 compared with 0 h, and *** indicates p < 0.001 compared with control. Error bars represent S.E. WB, Western blotting.

