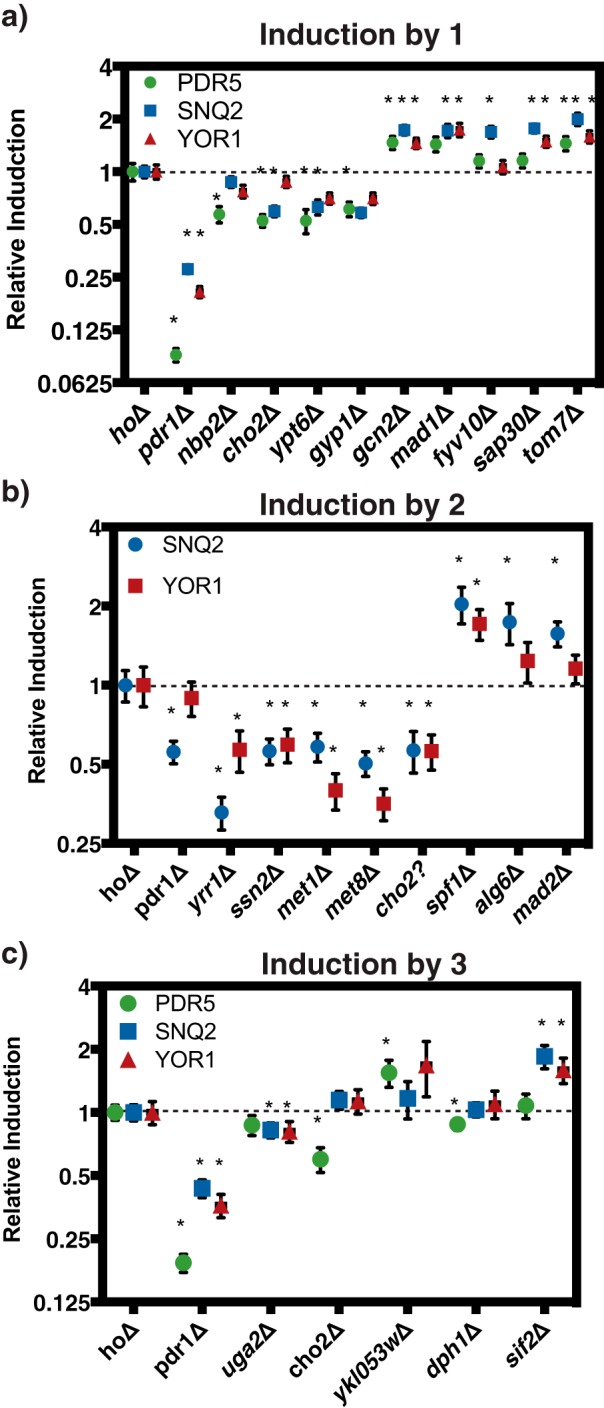
Figure 3.

qPCR validation of PDR transcriptional responses confirms screen hits. Strains were grown to mid-exponential phase and treated with the indicated compounds at 50 μm for 1 h. Relative induction was calculated by comparing the fold-induction of the transporter gene between hoΔ and the deletion strain. Error bars represent S.D. (n = 3). *, indicates p < 0.05, based on Student's t test on the fold-induction of the transporter gene between hoΔ and the deletion strain. Treatment with (a) 1, (b) 2, and (c) 3.
