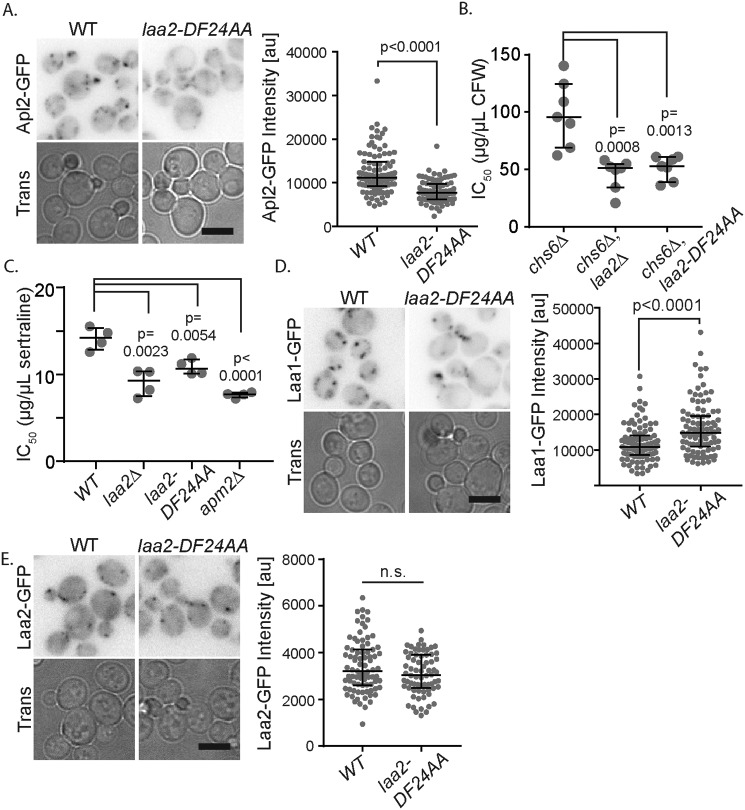
Figure 5.
Laa2 ear-binding motif is important for AP-1 localization and function but not Laa1 localization. A, WT or laa2–DF24AA cells expressing Apl2-GFP from its endogenous locus were imaged by fluorescence microscopy. B, IC50 values for CFW in indicated strains. C, IC50 values for sertraline in indicated strains. D, WT or laa2-DF24 expressing Laa1-GFP from its endogenous locus were imaged by fluorescence microscopy. E, GFP-tagged WT or laa2–DF24AA was expressed from its endogenous locus and imaged by fluorescence microscopy. For microscopy analysis, charts show the intensity of individual puncta, representative of three repeats. Bars indicate median and interquartile ranges. p values were determined by Mann–Whitney rank-sum analysis. Scale bars are 5 μm. For IC50 values, charts show individual repeats, bars indicate median and interquartile range. p values were determined by two-tailed Student's t test. n.s., not significant.

