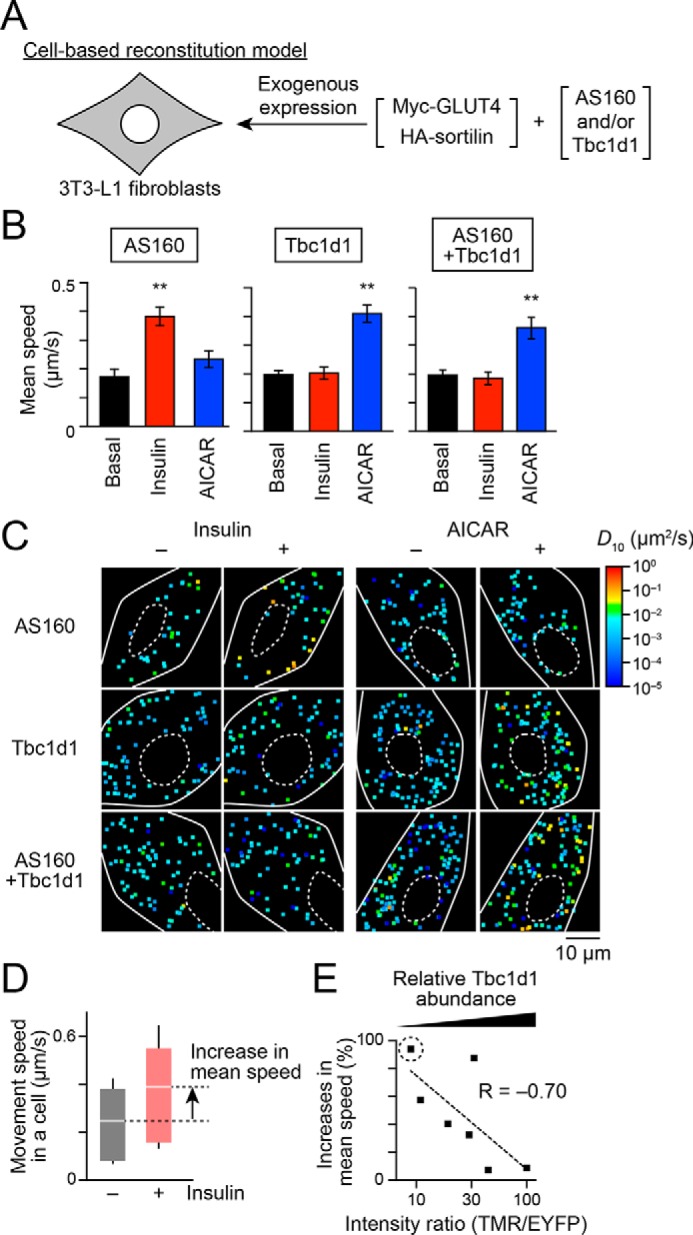
Figure 1.

Dominant actions of Tbc1d1 in insulin-responsive GLUT4 liberation in cells co-expressing AS160 and Tbc1d1. A, cell-based reconstitution model. In this study, 3T3-L1 fibroblasts exogenously expressing Myc-GLUT4, HA-sortilin, and both Tbc1d1 and AS160, or either one alone, were used. B, mean speed of intracellular movement of GLUT4 under the indicated conditions in cells expressing Tbc1d1 (left), AS160 (middle), or both (right). The cells were simulated without (black) or with insulin (red; 100 nm) or AICAR (blue; 1 mm) for 30 min. **, p < 0.01 by Dunnett's multiple comparison versus basal states (n = 6–8). C, representative diffusion coefficient maps of GLUT4 movement in cells under the indicated conditions. D, box plots of GLUT4 movement speeds in a cell expressing EYFP-AS160 and HaloTag-Tbc1d1 before (black) and after (red) insulin stimulation (100 nm, 30 min). HaloTag-Tbc1d1 was stained with HaloTag TMR ligand, and epifluorescence of TMR and EYFP was acquired just before analyzing single-molecule GLUT4 behavior. The ratio of HaloTag-Tbc1d1 to EYFP-AS160 was calculated on the basis of their fluorescence intensities. We also calculated the percentage increase in the mean movement speed of GLUT4 in response to insulin stimulation (arrow). Intensity ratio (TMR/EYFP) and percentage increase in the movement speed in this cell were 9.4 and 94.1%, respectively. White lines and error bars represent mean and S.D., respectively. E, relationship between insulin-responsive GLUT4 liberation and relative Tbc1d1 abundance to that of AS160. Each dot represents a cell. A dot surrounded by a dotted circle represents the data shown in D.
