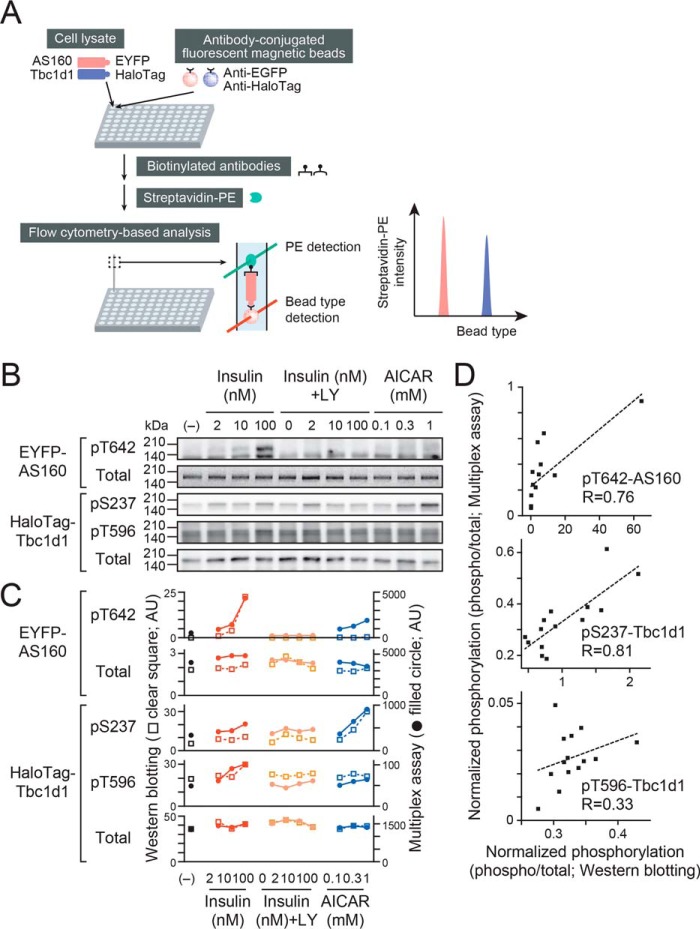
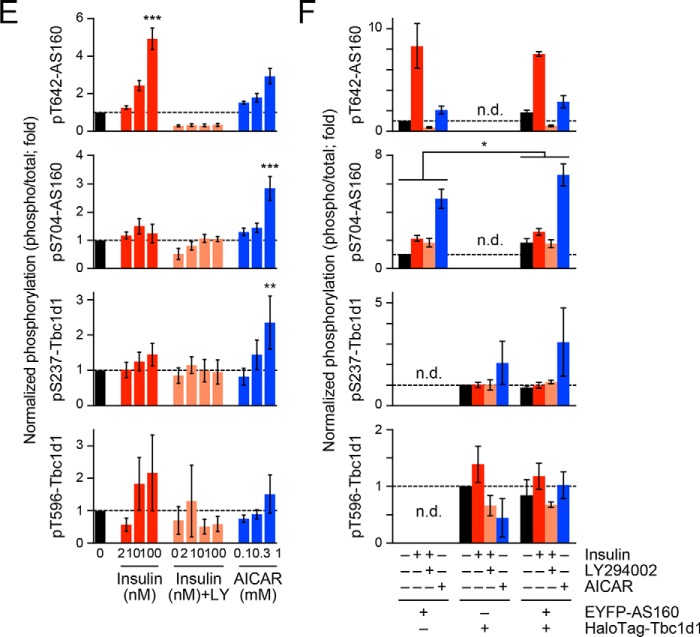
Figure 2.
Analysis of phosphorylation signals of AS160 and Tbc1d1 by multiplex assay. A, schematic drawing for multiplex assays of phosphorylation signals. B, representative Western blotting of HaloTag-Tbc1d1 or EYFP-AS160 (phosphorylation or total) of cell lysates treated under the indicated conditions. Note that total EYFP-AS160 was obtained by its EYFP fluorescence. Some cells were pretreated with LY294002 (LY; 50 μm) for 30 min before stimulation with insulin or AICAR for 10 min. C, quantification of HaloTag-Tbc1d1 or EYFP-AS160 (phosphorylation or total) analyzed by Western blotting (open squares) and multiplex assay (filled circles). These values were obtained from the same samples as those shown in B. D, correlation between results obtained with the two assay systems. The values were obtained from the data shown in C and are presented as ratios (phosphorylation/total). E, -fold changes in phosphorylation of HaloTag-Tbc1d1 and EYFP-AS160 analyzed by multiplex assays. **, p < 0.01; ***, p < 0.001 by Dunnett's multiple comparison versus basal states (n = 3). F, phosphorylation signals in the co-presence of AS160 and Tbc1d1. The values are shown as ratios (phosphorylation/total) and as -fold increases, as compared with untreated cells expressing either AS160 or Tbc1d1. *, p < 0.05 by two-way repeated measures analysis of variance for the expressed proteins (n = 3). n.d., not detected. Error bars, S.E.


