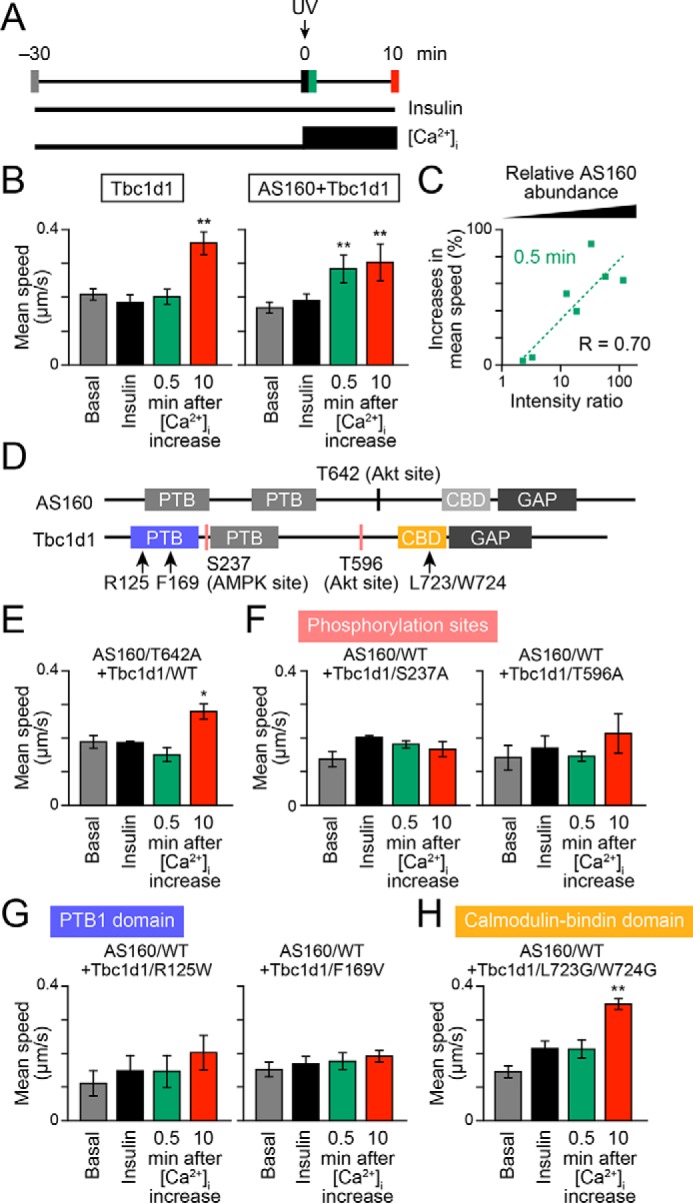
Figure 4.

Accelerating potency of AS160 to insulin-responsive GLUT4 liberation in response to treatment with insulin and Ca2+ combined. A, treatment and acquisition protocols. Cells were first stimulated with insulin (100 nm) for 30 min, and then, at time 0, photolysis of the caged Ca2+ compound NPE was induced (UV; arrow). Imaging was performed in the basal (gray), insulin-stimulated (black), and after (green, 0.5 min; red, 10 min) photolysis states. B, mean speeds of intracellular movements of GLUT4 in cells expressing Tbc1d1 (left) or both AS160 and Tbc1d1 (right). **, p < 0.01 by Dunnett's multiple-comparison versus insulin-stimulated states (just before photolysis) (n = 6–8). C, relationship between insulin-responsive GLUT4 liberation at 0.5 min of photolysis and relative AS160 abundance. D, schematic domain structures of human AS160 and Tbc1d1. Mutated amino acids are shown as text. E–H, effects of AS160 (E) or Tbc1d1 (F–H) mutants on GLUT4 liberation in response to combined treatment with insulin and Ca2+. *, p < 0.05; **, p < 0.01 by Dunnett's multiple comparison versus insulin-stimulated states (n = 5–7). Error bars, S.E.
