Figure 1.
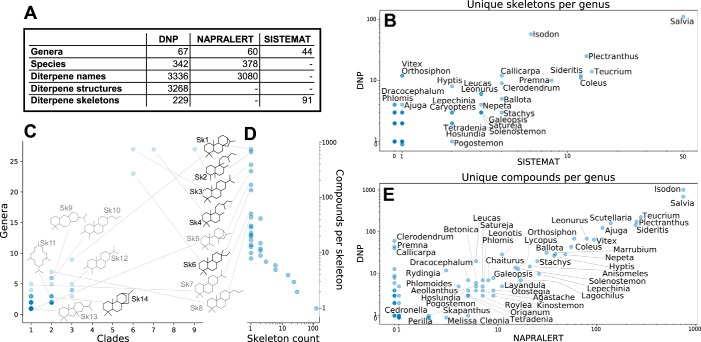
Distribution of diterpenes in the Lamiaceae. A, comparison of different sources for data about Lamiaceae diterpene chemotaxonomy. B, diterpene skeletons per genus according to both the DNP and SISTEMAT. C, distribution of skeletons among the genera and 12 primary clades of Lamiaceae, based on the DNP. A circle in C represents one skeleton, with its vertical position indicating how many genera that skeleton has been reported in and its horizontal position indicating how many of the 12 clades are represented by those genera. Structures are shown for selected skeletons; in black are those where a biosynthetic route is known from the Lamiaceae, and in gray are those for which the pathway remains unknown. D, distribution of compounds among skeletons, based on the DNP. Each circle in D represents a number of skeletons indicated by the horizontal position of the circle, with vertical position indicating the number of compounds reported with each of those skeletons; the data point in the bottom right shows that there are more than 100 skeletons that are represented by only one compound apiece. E, diterpene structures per genus according to both the DNP and NAPRALERT. Data points in B–E are represented by semitransparent circles, so darker spots indicate overlapping data points. Some genus name labels in B and E have been omitted due to space constraints. An exhaustive list of the occurrence of skeletons in genera of Lamiaceae is given in Data set S3, skeleton distribution.

