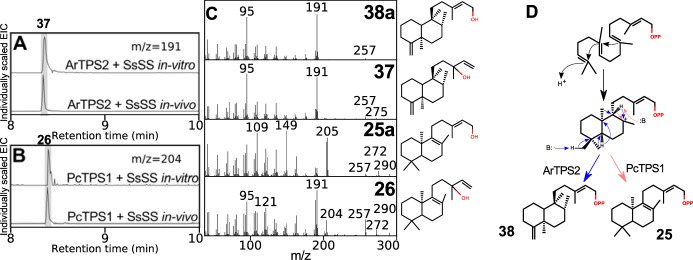
Figure 5.
Activities of ArTPS2 and PcTPS1. A and B, GC-MS–extracted ion chromatograms of activity assays for ArTPS2 + SsSS (A) and PcTPS1 + SsSS (B), in vitro with purified protein fed with GGPP and in vivo from N. benthamiana transiently expressing the gene combinations. C, mass spectra for the products of ArTPS2 and PcTPS1, and their combinations with SsSS. D, proposed mechanisms for ArTPS2 (blue) and PcTPS1 (pink).

