Figure 3.
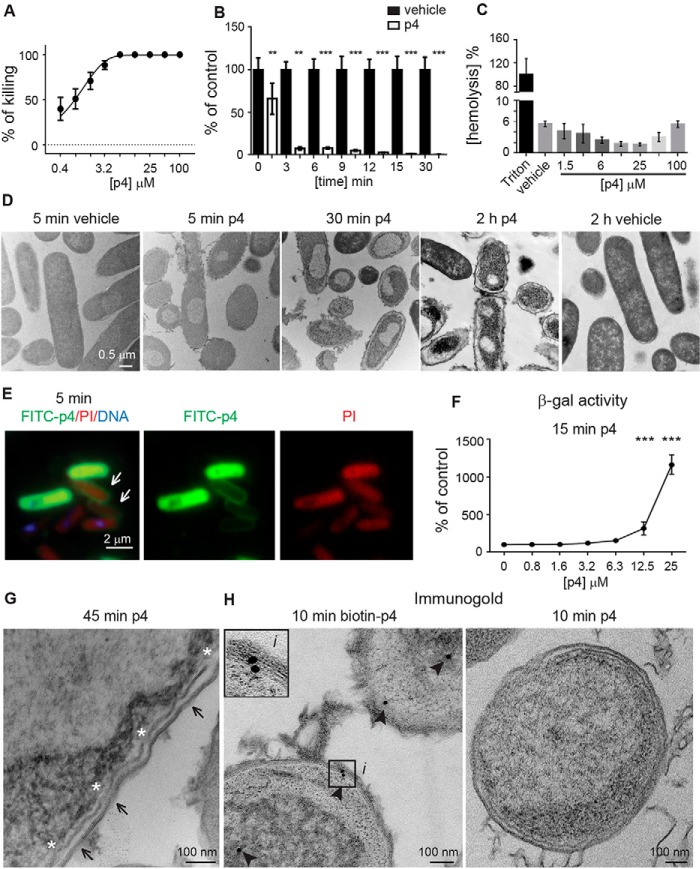
p4 exhibits rapid concentration-dependent lytic activity against E. coli. A, E. coli HB101 was incubated with the indicated concentrations of p4 for 2 h. Cell viability was analyzed by MDA assay. n = 3, mean ± S.D. B, E. coli HB101 was incubated with 100 μm p4 or vehicle for the indicated times. Cell viability was analyzed by MDA assay, n = 3; mean ± S.D. C, human erythrocytes were incubated with 1% Triton X-100, the indicated concentration of p4, or vehicle for 2 h. Hemolysis of erythrocytes is shown relative to lysis caused by Triton X-100. n = 3, mean ± S.D. D, E. coli HB101 was incubated with 100 μm p4 or vehicle for the indicated times. Bacterial morphology was assessed by TEM. E, E. coli HB101 was incubated with 100 μm p4 for 5 min. Alterations in bacterial permeability were visualized by fluorescence imaging. Bacteria were treated with FITC-labeled p4 (green), stained with PI (red), and counterstained with Hoechst to visualize DNA (blue). Arrows point to accumulation of p4 at the cell surface. F, β-gal–expressing E. coli JM83 was incubated with the indicated concentrations of p4 for 15 min. The β-gal activity present in supernatants of p4-treated bacteria is shown as a percentage of the vehicle-treated bacteria. n = 3, mean ± S.D. G, E. coli HB101 was treated with p4 for 45 min, followed by TEM. Arrows and asterisks indicate outer membrane perturbations and the discontinuous inner membrane, respectively. H, intracellular localization of p4 is shown by immunogold labeling. E. coli HB101 was treated with biotin-p4 or p4 as a control, fixed, and stained with mouse anti-biotin Abs, followed by anti-mouse Abs conjugated to gold particles. Arrowheads indicate gold particles. The enlarged image (i) demonstrates interaction of p4 with the cell membrane. ***, p < 0.001; **, p < 0.01; *, p < 0.05 by Kruskal-Wallis one-way ANOVA with post hoc Dunn's test. TEM and fluorescence microscopy images are from one experiment and are representative of at least three experiments.

