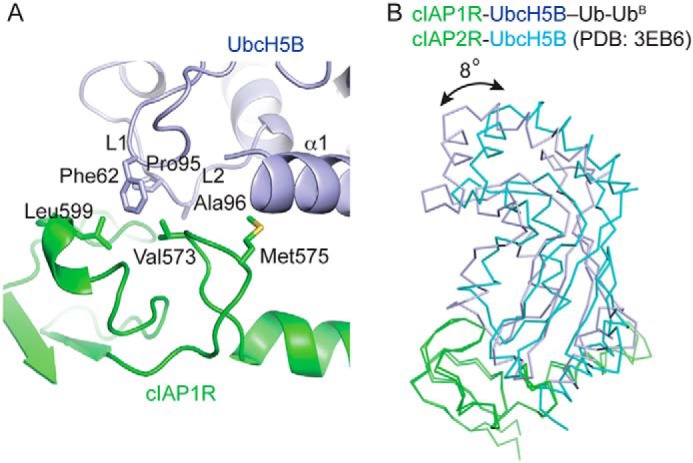
Figure 3.

cIAP1R-UbcH5B interactions. A, close-up view of cIAP1R-UbcH5B interactions. UbcH5B's α1, L1, and L2 loops are indicated. All coloring is the same as in Fig. 2. B, superimposition of cIAP1R portion of structure in cIAP1R-UbcH5B–Ub-UbB complex with cIAP2R portion of structure in cIAP2R-UbcH5B complex (PDB entry 3EB6). cIAP1R and cIAP2R are colored in green. UbcH5B from cIAP1R-UbcH5B–Ub-UbB and cIAP2R-UbcH5B complexes are colored in light blue and cyan, respectively.
