Figure 6.
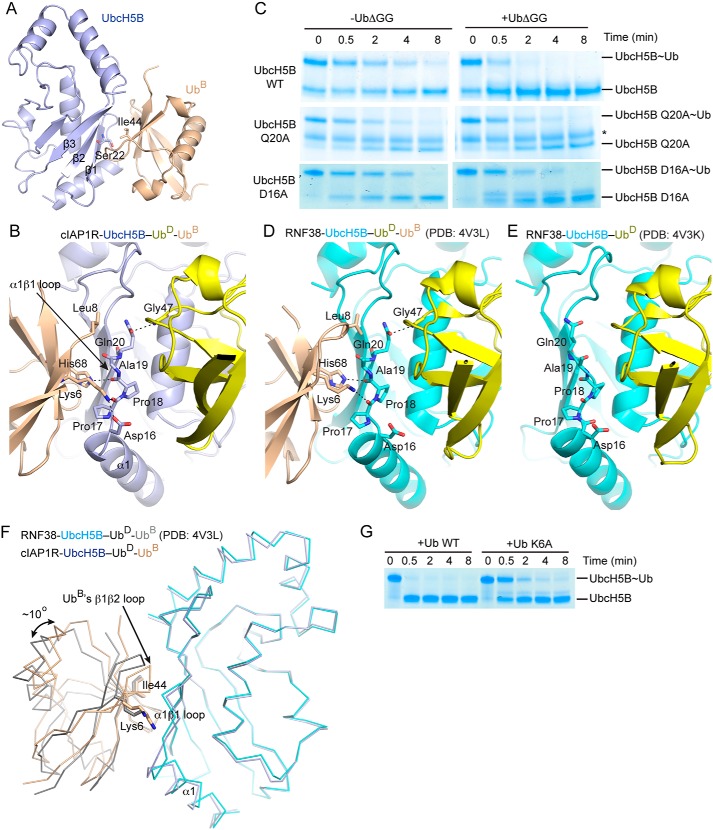
UbB interactions. A, cartoon representation showing the UbcH5B–UbB portion of the structure from the cIAP1R-UbcH5B–Ub-UbB complex. Ile44 of UbB and Ser22 of UbcH5B are indicated. B, close-up view of UbB-UbcH5B–UbD binding interface. UbcH5B's α1β1-loop is indicated by an arrow. Hydrogen bonds are shown as dotted lines. All coloring in A and B is the same as in Fig. 2. C, nonreduced SDS-PAGE of lysine discharge reactions showing the disappearance of UbcH5B variant∼Ub bands over time in the presence and absence of UbΔGG catalyzed by cIAP1R. *, contaminating band from other reaction components. D, close-up view of UbB-UbcH5B–UbD binding interface in the structure of RNF38-UbcH5B–Ub-UbB complex (PDB entry 4V3L). UbcH5B is shown in cyan, UbD in yellow, and UbB in wheat. E, close-up view of UbcH5B's α1β1-loop in the structure of RNF38-UbcH5B–Ub complex (PDB entry 4V3K). UbcH5B is shown in cyan and UbD in yellow. D and E are shown in the same orientation as in B. F, comparison of UbB conformations in the structures of cIAP1R-UbcH5B–Ub-UbB and RNF38-UbcH5B–Ub-UbB complexes (PDB entry 4V3L). Superimposition was performed on all Cα atoms of the UbcH5B portion of the structure. Ribbon representations of the UbcH5B-UbB portion from both structures are shown. UbB's β1β2 loop is indicated by an arrow. UbcH5B and UbB from cIAP1R-UbcH5B–Ub-UbB structure are colored as in Fig. 2. UbcH5B and UbB from RNF38-UbcH5B–Ub-UbB structure are colored in cyan and gray, respectively. G, nonreduced SDS-PAGE of lysine discharge reactions showing the disappearance of the UbcH5B∼Ub band over time in the presence of excess WT Ub or Ub K6A catalyzed by cIAP1R.

