
Figure 4.
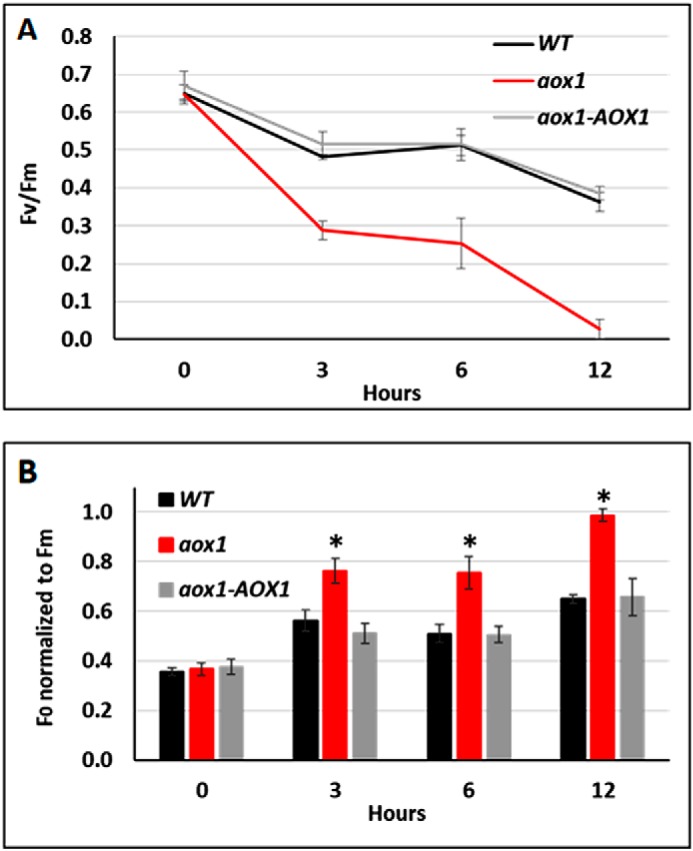
Functional analyses of PSII in WT, aox1 mutant, and the rescued strain. A, activity of PSII (F′v/F′m) at various times following the transfer of the cells to HL. Fv = Fm − F0. Fluorescence parameters were measured after a 30–60-min preincubation in the dark. The curves for WT, aox1-5 (aox1), and complement (aox1-AOX1) strains are distinguished by color as indicated. Data shown are means ± S.D. (error bars) (n = 4). B, time course of F′0 normalized to F′m. The bars for WT, aox1-5 (aox1), and the complement strain (aox1-AOX1) are distinguished by color as indicated. Data shown are means ± S.D. (n = 4). Student's t tests were performed, and the asterisk represents a significant difference (p < 0.05).