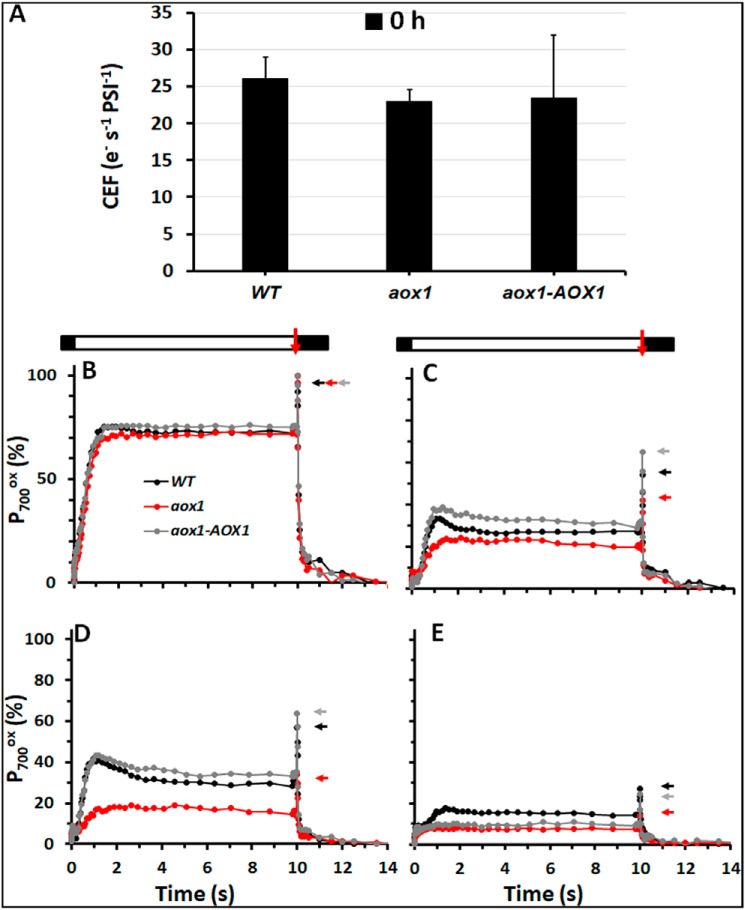
Figure 5.
Functional analyses of PSI in WT, aox1, and rescued strain. A, CEF rates under control conditions (0 h), for the various strains, as indicated. CEF measurements were also performed at 156 μmol of photons m−2 s−1 in the presence of 10 μm DCMU and 10 mm HA to inhibit any contribution from PSII, as described previously (106). The data are an average of four independent experiments. B–E, P700 kinetics in the WT, aox1-5 (aox1), and rescued (aox1-AOX1) strains over 12 h of HL treatment. PSI was oxidized and maintained at steady state in continuous light of 156 μmol of photons m−2 s−1 (white bar), followed by a saturating light pulse (red arrow from bar above the tracing) to generate total photooxidizable P700, which was then reduced during the dark period (black bar). PSI redox changes were measured at 705 nm and corrected by subtraction at 735 nm. 10 μm DCMU and 10 mm HA were added to the cells prior to the assay to inhibit PSII. The activity was measured at 0 h (B), 3 h (C), 6 h (D), 12 h (E). Colored arrows on the side of the tracing indicate the position of total photooxidizable PSI for each strain in each condition. The kinetics are the average of four independent experiments. Error bars, S.D.

