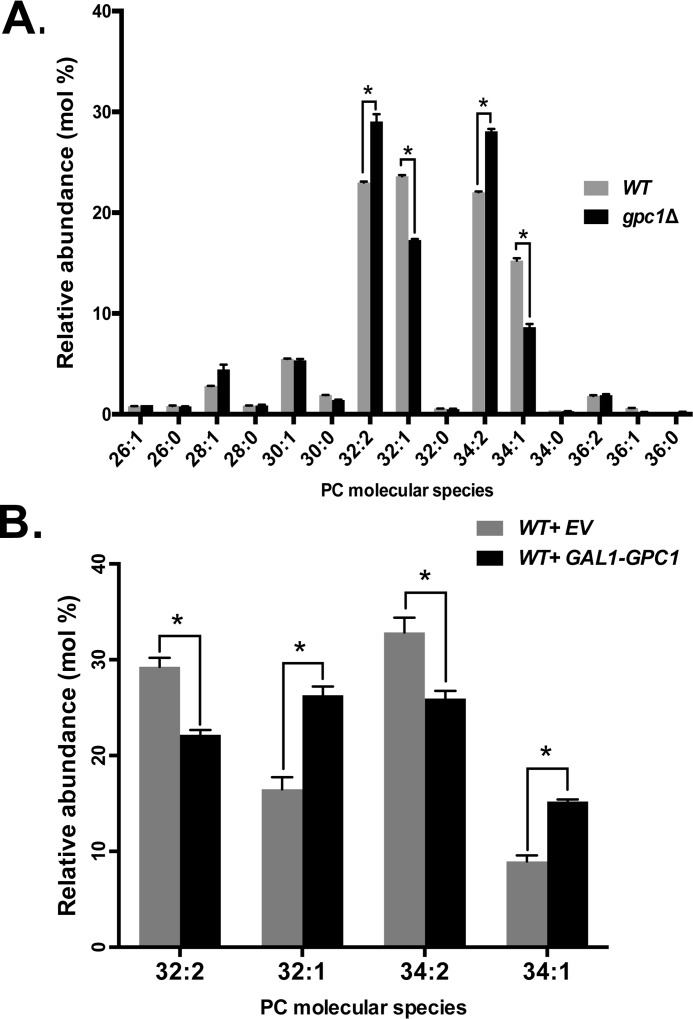
Figure 3.
Gpc1 impacts PC molecular species profile. A and B, the indicated strains were grown to late log phase, the cultures were harvested, and the lipids were extracted. PC species were separated and analyzed using LC-MS/MS, as described under “Experimental procedures.” The data represent averages of three independent cultures ± S.D. A t test was performed to determine significance as indicated. *, p ≤ 0.05.

