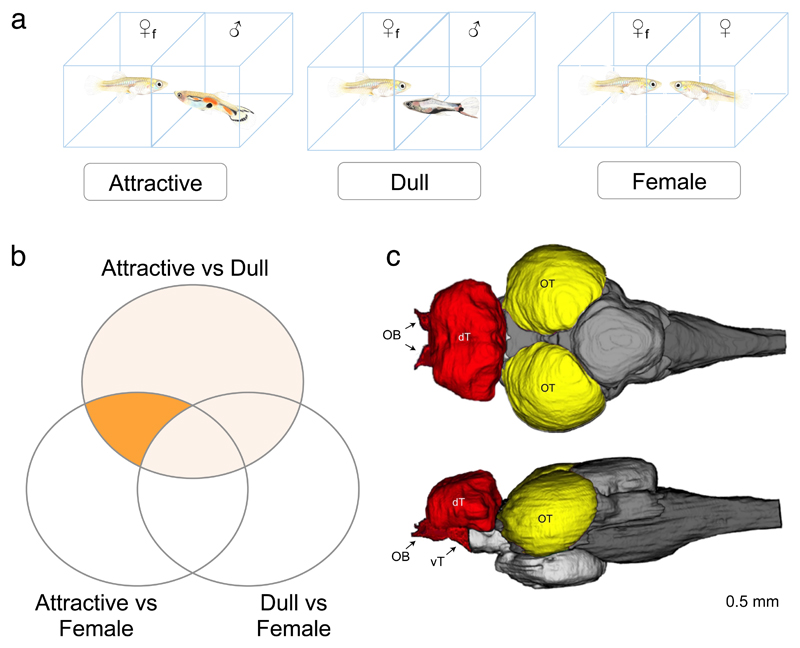
Figure 1. Experimental setup used to find neurogenomic pathways associated with mate preferences.
(A) Diagram of the three treatments: Focal females (♀f) were exposed to either an attractive male (left), a dull male (center) or another female as a control condition (right). Note, guppies are not drawn to scale. (B) Venn diagram illustrating the various pairwise comparisons used to identify differentially expressed genes between treatments. Identification of differentially expressed genes and permutations were performed for each pairwise treatment comparison and separately for Preference and Non-preference lines in both tissues. See Table 1 for results of all comparisons. Area “x” indicates all genes differentially expressed between the attractive and dull treatments and “P” is the final set of Preference DE genes, after filtering to keep only those Attractive vs Dull DE genes that are also differentially expressed in the Attractive vs Female comparison but not in the Dull vs Female (see methods for details). (C) Schematic representation of a top view (top) and lateral view (bottom) of the major regions of the guppy brain. We examined gene expression in the optic tectum (OT, yellow) and the telencephalon (T, red) which included dorsal telencephalon, ventral telencephalon, preoptic area and olfactory bulbs. The latter are less than 2.9% of the mass. The optic tectum samples included the laminated superior area of both hemispheres.

