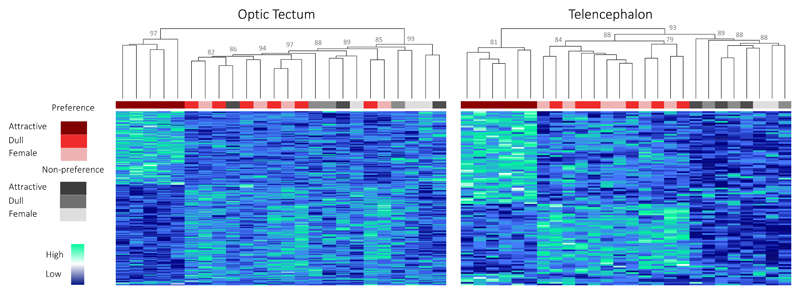
Figure 2. Hierarchical gene-expression clustering of Preference DE genes.
Hierarchical gene-expression clustering of samples for Preference DE genes differentially expressed between attractive and dull male treatments in the optic tectum (n=193) and telencephalon (n=106). Colors below dendrogram correspond to sample treatment and line as outlined in the legend. Values on top of nodes correspond to bootstrap Approximately Unbiased p-values, computed by multiscale bootstrap resampling90 (all bootstrap values >70%, those <80% not shown for clarity).

