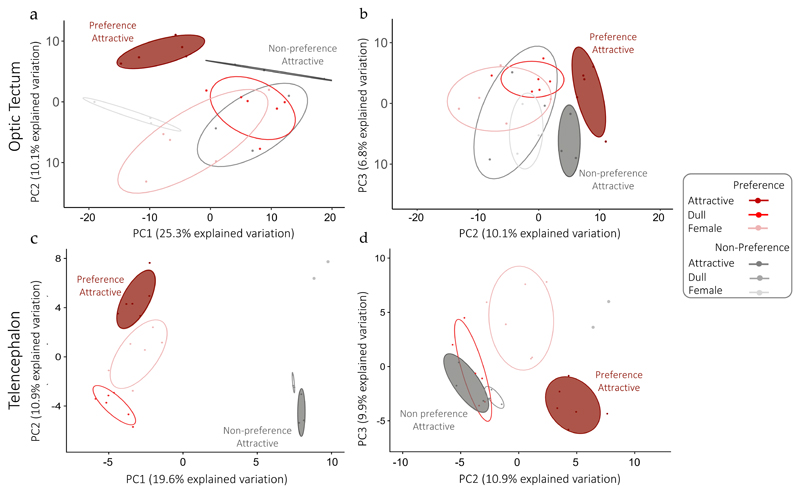
Figure 4. Differential transcriptional signature of Social DE genes in females exposed to attractive males.
Principal component analysis of Social DE genes in optic tectum (A, n=347) and telencephalon (B, n=161). Points represent samples for each treatment/line group. In graphs on the left the two first principal components are plotted, and in graphs on the right PC2 is plotted against PC3, with the proportion of variance explained by each component printed next to the axes labels.

