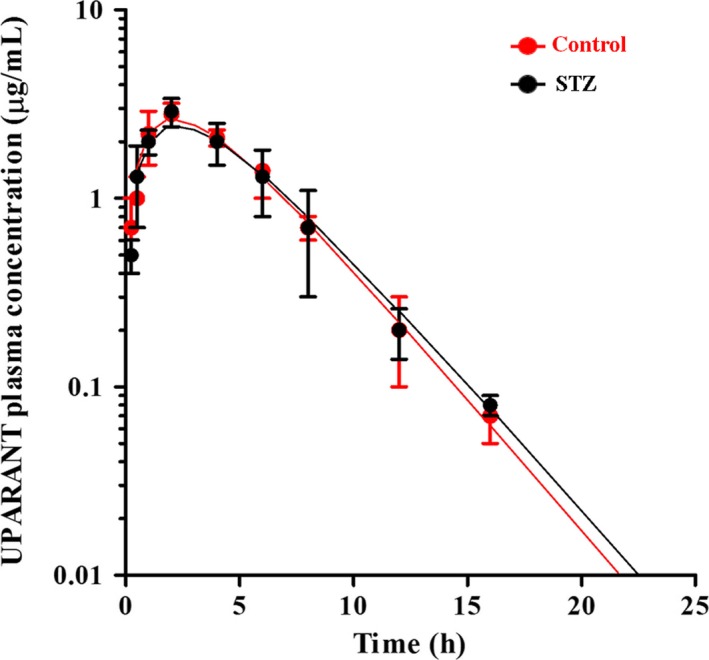
Figure 1.

Average plasma concentrations of UPARANT after subcutaneous administration (20 mg/kg) to control (red dots and line) or STZ rats (black dots and line). Continuous lines correspond to the best fit of the equation Ct = C0(e−kelim∙t − e−kabs∙t) where kelim and kabs correspond to the kinetic constants of the elimination and absorption phase, respectively. Values are expressed as means ± SD
