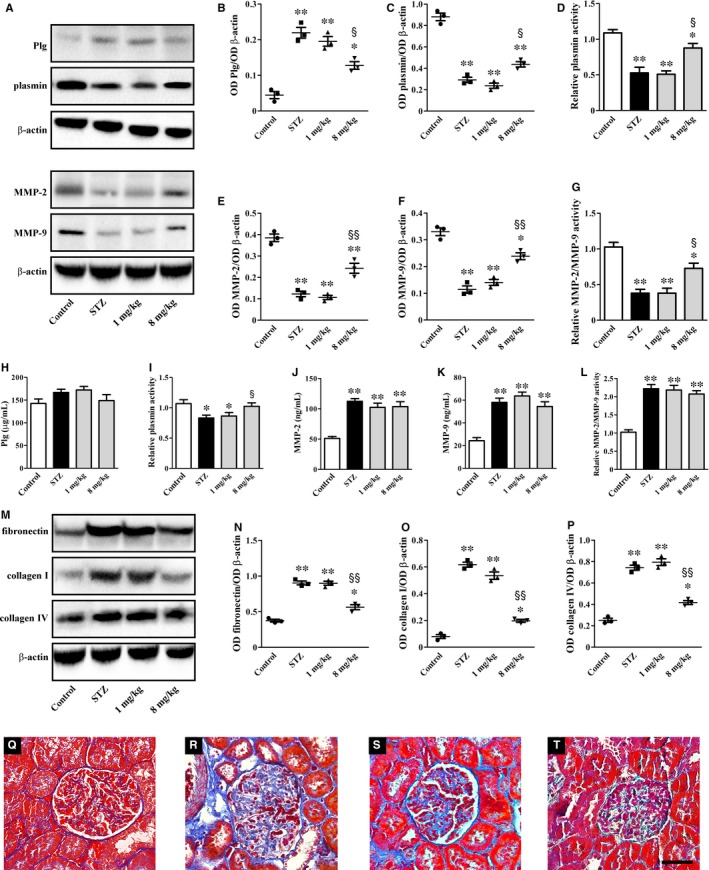
Figure 4.

UPARANT effects on renal fibrosis. (A) Representative blots showing protein levels of Plg, plasmin, MMP‐2 and MMP‐9 in kidney extracts. β‐actin was used as the loading control. (B, C, E, F) Densitometric analysis showing that UPARANT at 8 mg/kg, but not at 1 mg/kg, almost recovered dysregulated levels of Plg, plasmin, MMP‐2 and MMP‐9. (D, G) Down‐regulated activity of both plasmin and MMPs was unaffected by UPARANT at 1 mg/kg, but was increased by UPARANT at 8 mg/kg. (H‐L) In the plasma, Plg levels, plasmin activity, MMP‐2 and MMP‐9 levels and their activity were unaffected by UPARANT with the exception of plamin activity that was recovered by UPARANT at 8 mg/kg. (M) Representative blots showing protein levels of ECM components including fibronectin, collagen I and collagen IV. β‐actin was used as the loading control. (N‐P) Densitometric analysis showing that UPARANT at 8 mg/kg, but not at 1 mg/kg, reduced up‐regulated levels of ECM components (*P < 0.01 and **P < 0.001 vs control; § P < 0.01 and §§ P < 0.001 vs STZ; one‐way ANOVA followed by Newman‐Keuls’ multiple comparison posttest). Data are presented as scatter plots (B, C, E, F, N‐P) or histograms (D, G, H‐L). Each plot or column represents the mean ± SEM of data from three (B‐G, N‐P) or seven (H‐L) independent samples. (Q‐T) Histological assessment of renal fibrosis in control (Q) and STZ rats either untreated (R) or treated with UPARANT at 1 mg/kg (S) or 8 mg/kg (T). Representative photomicrographs from Masson's Trichrome staining of sections that are representative of three animals/group showing that increased glomerular fibrotic areas (stained in blue) were reduced by UPARANT at 8 mg/kg, but not at 1 mg/kg. Scale bar: 50 μm
