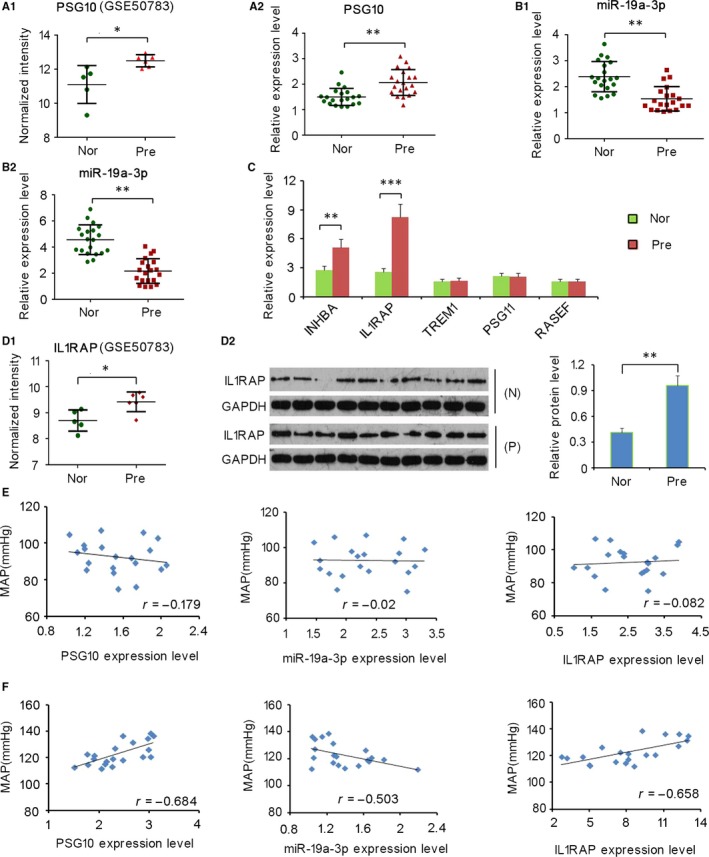
Figure 1.

Expression profiles of PSG10P, miR‐19a‐3p, and IL1RAP in placentas of patients with pre‐eclampsia (PE) and controls and their association with mean arterial pressure (MAP). Expression profiles of PSG10P (A1) and IL1RAP (D1) in GSE50783 datasets were analysed. RT‐PCR was performed to detect the expression of PSG10P (A2), miR‐19a‐3p (B1), and a series of mRNAs (C) in placentas of patients with PE and controls. miR‐19a‐3p expression was also detected in the serum samples using RT‐PCR (B2). Western blotting was performed to detect the expression of IL1RAP in placentas of patients with PE and controls (D2). Association of the relationship between MAP and relative RNA expression of PSG10P, miR‐19a‐3p, and IL1RAP was analysed by Pearson correlation analysis in patient with PE (F) and normal controls (E). Nor and N:Normal group; Pre and P: Pre‐eclampsia group; MAP: Mean arterial pressure. *P < 0.05, **P < 0.01, ***P < 0.001 vs Control
