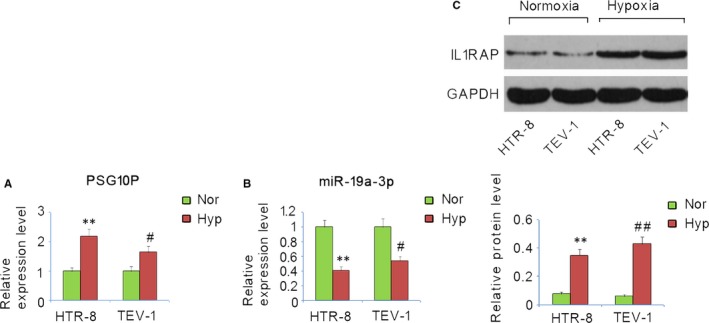
Figure 2.

Expression profiles of PSG10P, miR‐19a‐3p, and IL1RAP in trophoblast cells under hypoxia and normoxia. HTR‐8/SVneo and TEV‐1 cells were cultured under hypoxia or normoxia. Expression profiles of PSG10P (A), miR‐19a‐3p (B), and IL1RAP (C) in trophoblast cells were assessed by RT‐PCR and western blot assays. Hyp: hypoxia; Nor: normoxia. *P < 0.05, **P < 0.01 vs HTR‐8/SVneo cells under normoxia; # P < 0.05, ## P < 0.01 vs TEV‐1 cells under normoxia
