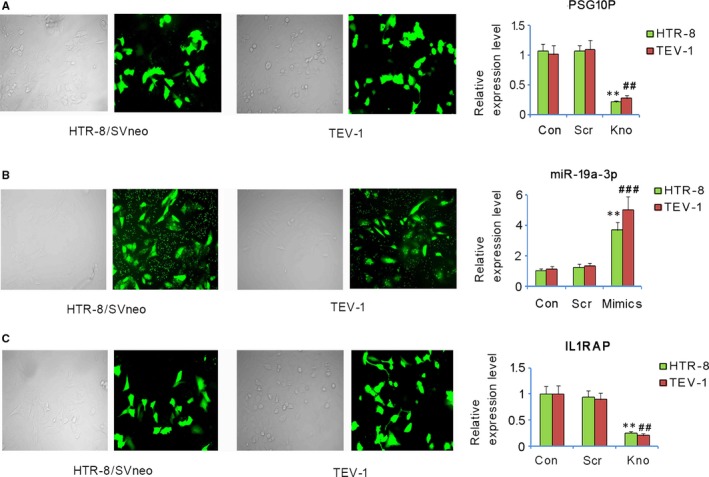
Figure 3.

Changes of PSG10P, miR‐19a‐3P, and IL1RAP expression in trophoblast cells after transfection. HTR‐8/SVneo and TEV‐1 cells were transfected with shRNA‐PSG10P (A), hsa‐miR‐19a‐3p mimics (B), shRNA‐IL1RAP (C), and their negative controls. The transfection rate was determined by light microscopy and fluorescent images. PSG10P, miR‐19a‐3P, and IL1RAP expression were assessed by PT‐PCR. Con: control; Scr: scramble; Kno: knockdown of PSG10P or IL1RAP. *P < 0.05, **P < 0.01 vs HTR‐8/SVneo cells in control; # P < 0.05, ## P < 0.01, ### P < 0.001 vs TEV‐1 vs TEV‐1 cells in control
