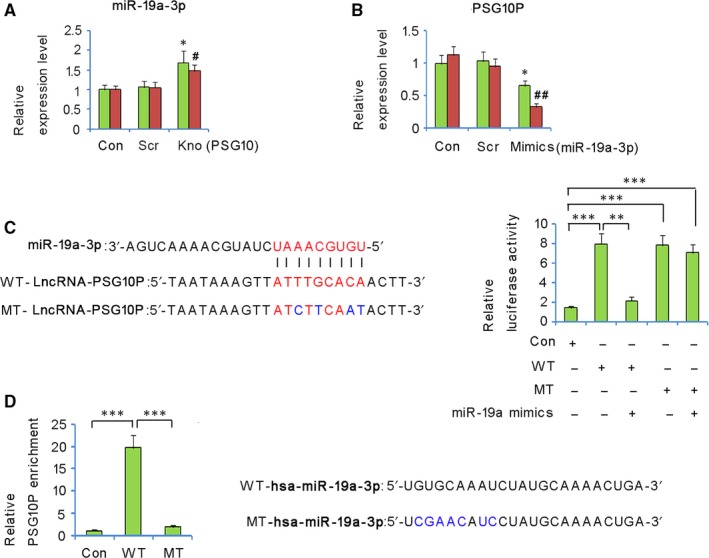
Figure 4.

Negative correlation between PSG10P and miR‐19a‐3p expression in trophoblast cells. miR‐19a‐3p expression in trophoblast cells was analysed by RT‐PCR after PSG10P knockdown (A); PSG10P expression in the trophoblast cells was analysed by RT‐PCR after transfection with miR‐19a‐3p mimics (B). *P < 0.05, **P < 0.01 vs HTR?8/SVneo cells in control; # P < 0.05, ## P < 0.01 vs TEV?1 cells in control. In a luciferase reporter assay, transfection with miR‐19a‐3p mimics significantly reduced the luciferase activity of the wild‐type of PSG10P constructs, but not that of the mutant PSG10P constructs (C). RNA pull‐down analysis indicated that PSG10P interacted with WT‐hsa‐miR‐19a‐3p, but not with MT‐hsa‐miR‐19a‐3p (D). *P < 0.05, **P < 0.01, and ***P < 0.001
