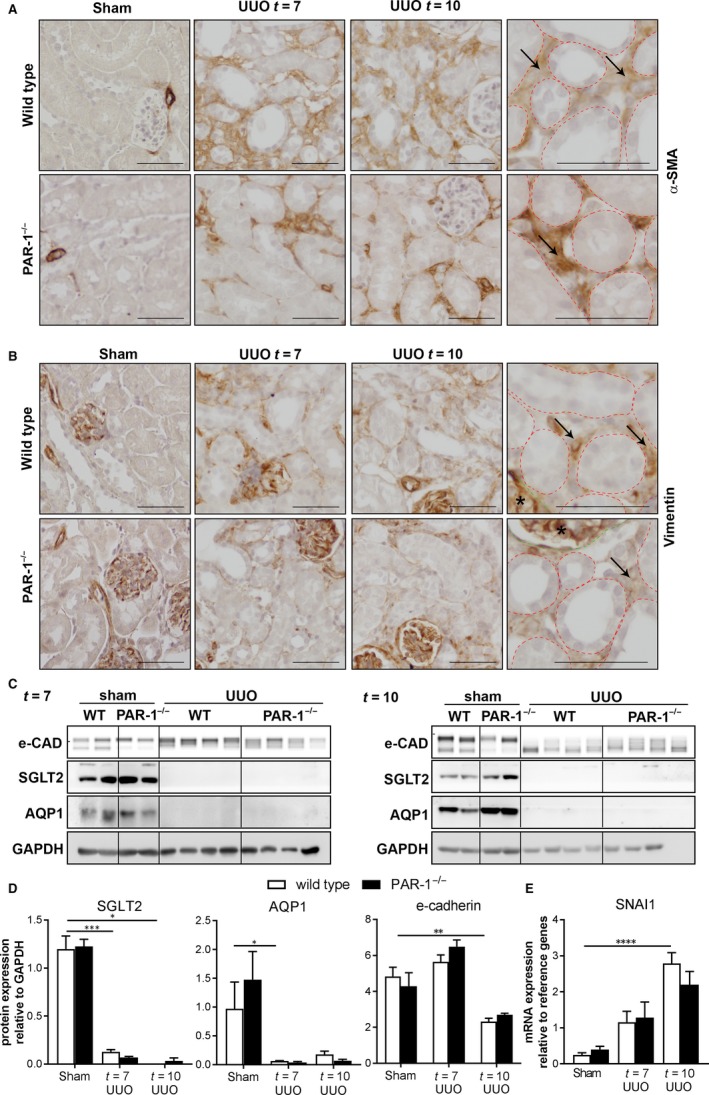
Figure 4.

Interstitial expression of mesenchymal markers, in wild‐type and PAR‐1‐deficient mice. Representative images of α‐SMA (A)‐ and vimentin (B)‐stained kidney slides of wild‐type and PAR‐1‐deficient mice 7 and 10 d after UUO and in unobstructed (Sham) control kidneys; scale bars represent 50 μm. C, Western blot analysis of E‐cadherin, SGLT2 and AQP1 in whole kidney lysates of unobstructed (sham) and obstructed (UUO) kidneys of wild‐type (WT) and PAR‐1‐deficient (PAR‐1−/−) mice, 7 and 10 d after UUO. GAPDH expression served as loading control. D, Quantification of Western blots depicted in panel C. E, SNAI1 mRNA expression in whole kidney lysates of unobstructed (sham) and obstructed (UUO) kidneys of wild‐type (WT) and PAR‐1‐deficient (PAR‐1−/−) mice, 7 and 10 d after UUO. *P < 0.05; **P < 0.01; ***P < 0.005; ****P < 0.001 (one‐way ANOVA followed by Bonferroni multiple comparisons test)
