
Figure 1.
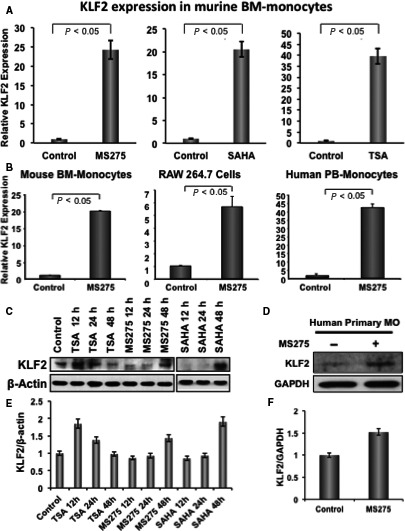
HDAC inhibitor induces KLF2 expression in monocytes. (A) Real‐time RT‐PCR was performed to evaluate the level of relative KLF2 expression in RNA isolated from mouse primary bone marrow‐derived monocytes (n = 3), after treating with 10 nmol/L of various HDACi (MS275, SAHA or TSA) for 24 h, and without stimulus (DMSO) was considered as a base line control of KLF2 expression, and the relative fold expression was graphically presented. GAPDH was considered as an internal control. Experiments were performed in triplicate. (B) Similar experiment was performed with mouse primary bone marrow‐derived monocytes (n = 3), mouse monocyte cell line (RAW 264.7) and human primary peripheral blood‐derived monocytes (n = 3) after treating with 10 nmol/L HDACi (MS275) for 24 h, and data are presented graphically. (C, D) Similar experiments were performed with mouse bone marrow monocytes, RAW 264.7, and human primary peripheral blood‐derived monocytes after stimulation with 10 nmol/L of TSA, or MS275 or SAHA, and proteins were evaluated at various time‐points as stated, and evaluated for KLF2 expression using Western blot methods using β‐actin as an internal control. (E, F) Quantified Western blot data of figures C, D are presented graphically