
Figure 2.
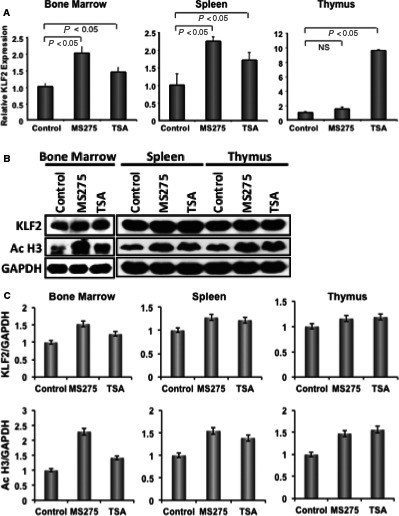
HDAC inhibitor induces KLF2 expression in various tissues in mice. (A) Three mice per group were injected (ip) with HDACi, and after 24 h bone marrow, spleen and thymus were harvested. Tissues were homogenized and part was subjected to real‐time RT‐PCR to evaluate the level of relative KLF2 expression in RNA. Vehicle control injected mice was considered as a base line control for KLF2 expression and the relative fold expression was graphically presented for various tissues. GAPDH was considered as an internal control. PCR experiments were performed in triplicate. (B) Other part of the tissues was subjected to protein extraction, and followed by Western blot analysis for KLF2 expression. The levels of KLF2 expression and acetylated Histone 3 were shown along with GAPDH (as an internal control). (C) Quantified Western blot data of stated molecules are presented graphically