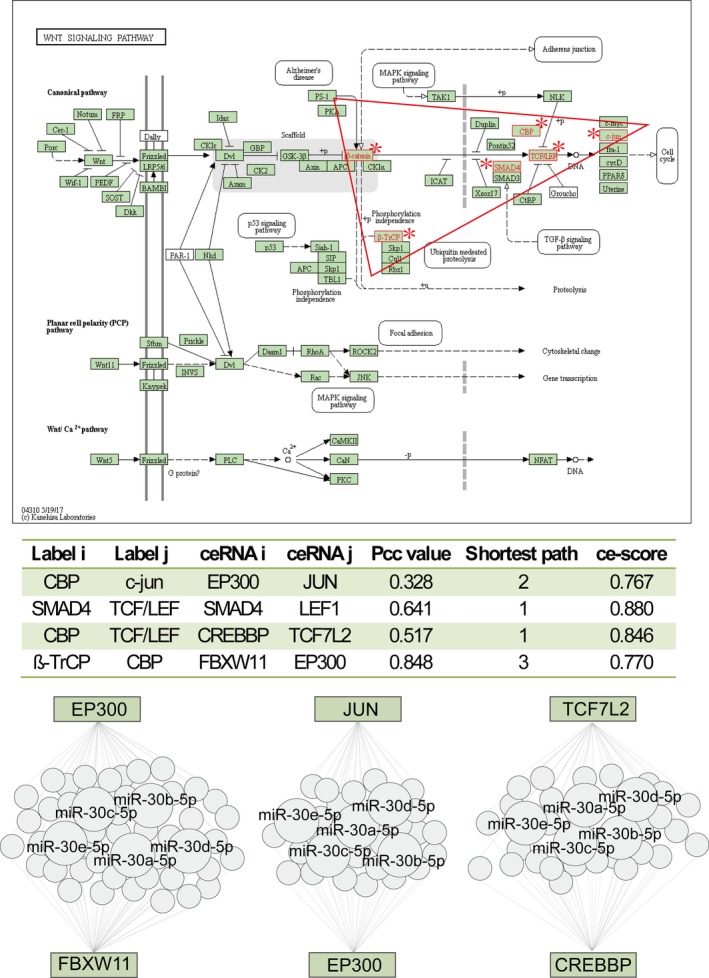
Figure 4.

The Wnt signalling pathway uniquely identified by ce‐Subpathway. The upper figure is the Wnt signalling pathway in KEGG. Red node labels and borders near asterisk symbol belong to the subpathway (path:04310_20) identified by ce‐Subpathway. Key subpathway region is shown in red triangle. The middle table lists all the ceRNA interactions of this subpathway with the corresponding ce‐scores. The bottom region shows three pairs of ceRNA interactions in this subpathway, which are formed by competing the common miRNAs
