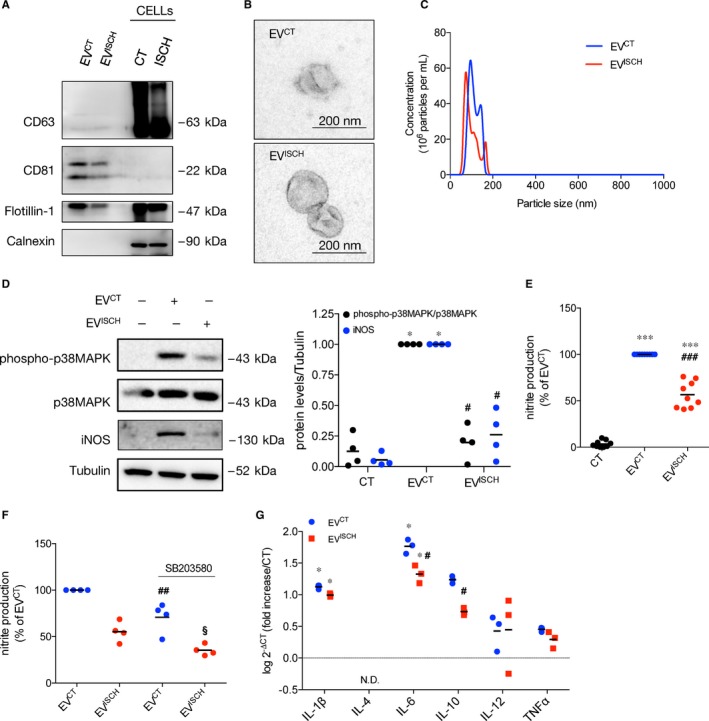
Figure 1.

Cardiomyocyte‐derived EVs modulate activation profile of macrophages. The cardiomyoblast cell line H9c2 was cultured under control (EVCT) or simulated ischaemia (EVISCH) for 2 hours, after which EVs were isolated by differential centrifugation. (A) The protein profile of EVs and cellular (CELLs) extracts was evaluated by WB, loading 20 μg of total protein in each case. (B) Representative image of EVCT and EVISCH observed by TEM. (C) Representative NTA analysis of concentration and size of EVs derived from 5.5 × 10⁶ H9c2 cells, maintained either in control or ischaemia for 2 hours. (D) Macrophages were incubated with EVCT or EVISCH for 24 hours. p38MAPK phosphorylation and iNOS expression were evaluated by WB in macrophages after incubation with EVCT or EVISCH for 24 hours. Graph depicts WB quantification. *P < 0.05 vs CT, # P < 0.05 vs EVCT (n = 4). (E) Nitrite production was determined using the Griess reagent assay in macrophages stimulated with EVCT or EVISCH for 24 hours. Results are expressed as percentage of nitrite production over macrophages treated with EVCT. *** P < 0.001 vs CT, ### P < 0.001 vs EVCT (n = 9). (F) Nitrite production was determined in macrophages, was pre‐treated with 10 μmol/L SB203580 for 1 hour, before incubation with EVCT or EVISCH for 24 hours. Results are expressed as percentage of nitrite production over macrophages treated with EVCT. ## P < 0.01 vs EVCT, § P < 0.05 vs EVISCH (n = 4). (G) mRNA expression levels of IL‐1β, IL‐4, IL‐6, IL‐10, IL‐12 and TNFα were assessed by RT‐qPCR in macrophages stimulated with EVCT or EVISCH. Results were normalized using GAPDH and expressed relatively to naïve macrophages (CT). Values are expressed as log2 − ΔCT. N.D. not detected. *P < 0.05 vs CT, # P < 0.05 vs EVCT (n = 3)
