Figure 6.

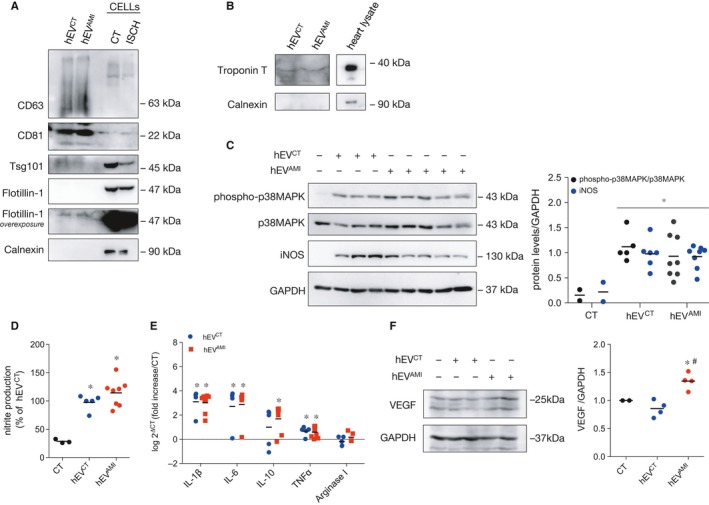
Circulating human EVs modulate the activation profile of macrophages. Circulating human EVs were isolated from serum of controls (hEVCT) or AMI patients (hEVAMI).(A) EV protein profile was evaluated by WB. H9c2 cell extracts (CELLs) were used as control. Twenty microgram of total protein was loaded in each case. (B) Representative WB analysis of circulating EVs. Troponin T was used as a cardiomyocyte marker and Calnexin was used as a negative EV marker. Heart lysates were used as positive control. (C) Macrophages were incubated with hEVCT or hEVAMI for 24 hours. p38MAPK phosphorylation and iNOS expression were evaluated by WB. Graph depicts WB quantification. *P < 0.05 vs CT (n = 5‐8). (d) Nitrite production was determined in macrophages treated with hEVCT or hEVAMI for 24 hours. Results are expressed as percentage of nitrite production over macrophages treated with hEVCT. *P < 0.05 vs CT (n = 5‐8). (E) mRNA expression levels of IL‐1β, IL‐6, IL‐10, TNFα and Arginase I was assessed using RT‐qPCR after treatment with hEVCT or hEVAMI for 24 hours. Results were normalized using GAPDH and expressed relatively to naïve macrophages (CT). Values are expressed as log2 − ΔCT (n = 5‐8). (f) VEGF levels were evaluated in macrophages stimulated with hEVCT or hEVAMI for 24 hours. Graph depicts quantification data. *P < 0.05 vs CT, # P < 0.05 vs hEVCT (n = 4)
